
About a month before this post, I wrote on LinkedIn that the weekend lab project was ready: an NVIDIA RTX PRO 4000 Blackwell SFF 24G 70W had arrived, and the plan was to add it to my homelab Kubernetes as a dedicated low-power GPU node for local AI experiments and automation.
The plan sounded clean enough: Proxmox passthrough, one VM, one k3s worker, one GPU runtime path, and enough validation to understand what actually works.
This is the Day 2 version of that idea.
Day 1 was about hardware bring-up: PCIe topology, firmware settings, VM shape, VFIO, driver behavior, and proving that the guest can see the card.
Day 2 is the more interesting operating problem: what changes once the GPU becomes a Kubernetes scheduling object instead of a device I can admire in
lspci.
This post is not a Proxmox passthrough tutorial. For that class of work I already have separate notes:
- Proxmox RX 7900 XTX Passthrough: Fix VFIO_MAP_DMA failed
- Proxmox Kiosk Desktop Appliance: Windows VM, GPU Passthrough, and Fast Recovery
Those posts are not about this exact NVIDIA card, but they cover the same kind of Proxmox/VFIO work: IOMMU groups, hostpci, VM shape,
firmware details, guest behavior, and the difference between “the VM booted” and “I would trust this as an operated system”.
The Day 2 Shape#
The final shape is intentionally boring:
- Proxmox gives one dedicated VM direct control of the physical GPU.
- k3s schedules GPU workloads onto that VM.
- the NVIDIA device plugin exposes
nvidia.com/gpu: 1as a Kubernetes resource. - Node Feature Discovery and NVIDIA GPU Feature Discovery label the node by hardware facts.
- llama.cpp is the active model server today.
- vLLM stays in Git as an experiment and rollback lane, but is not the default path on this card.
- LiteLLM is the stable API in front of the model servers.
- Argo CD keeps the desired state in Git.
- DCGM exporter feeds Prometheus and Grafana so I can see what the GPU is doing.
Architecture#
flowchart TB
  subgraph Hardware["Hardware and VM"]
    Card["RTX PRO 4000
24 GB / 70 W"]
    Proxmox["Proxmox
PCI passthrough"]
    Worker["dedicated k3s GPU worker VM"]
    Models["node-local /models disk"]
    Card --> Proxmox --> Worker
    Models --> Worker
  end

  subgraph Kubernetes["Kubernetes makes the GPU schedulable"]
    Runtime["RuntimeClass: nvidia"]
    Plugin["NVIDIA device plugin
nvidia.com/gpu"]
    Discovery["NFD + GFD
node labels"]
    Pod["one active GPU LLM pod"]
    Runtime --> Pod
    Plugin --> Pod
    Discovery --> Pod
  end

  subgraph Serving["Serving path"]
    Clients["clients and agents"]
    LiteLLM["LiteLLM gateway"]
    Llama["llama.cpp active lane"]
    VLLM["vLLM parked lanes"]
    Clients --> LiteLLM --> Llama
    LiteLLM -.-> VLLM
  end

  subgraph Ops["Operations"]
    Argo["Argo CD / GitOps"]
    Switch["preflight + switch helper"]
    DCGM["DCGM exporter"]
    Grafana["Prometheus / Grafana"]
    Argo --> Pod
    Switch --> Pod
    DCGM --> Grafana
  end

  Worker --> Pod
  Pod --> Llama
  Card --> DCGM
The components are not there for decoration:
- Virtualization: Proxmox PCI passthrough gives one VM direct access to the physical GPU.
- Runtime path: Kubernetes RuntimeClass selects the NVIDIA-capable runtime handler.
- GPU resource: Kubernetes device plugins and the
NVIDIA k8s device plugin make the card visible to kubelet as
nvidia.com/gpu. - Placement: Node Feature Discovery and NVIDIA GPU Feature Discovery publish hardware labels.
- Model runtime: llama.cpp server loads the local GGUF model, uses CUDA, exposes HTTP, and behaves predictably on this 24 GB card.
- Experiment lane: vLLM stays in Git for experiments and rollback.
- API gateway: LiteLLM proxy gives clients stable aliases like
fast,chat, andagent. - Desired state: Argo CD keeps Kubernetes state in Git and makes drift visible.
- Telemetry: DCGM exporter exports GPU memory, utilization, power, temperature, PCIe, throttling, and Xid signals for Prometheus.
Could I run one model directly with Docker on the VM? Yes. That would be faster for one shell and one model.
I chose the Kubernetes path because the GPU is not a toy process in isolation. It has clients, aliases, storage, alerts, rollbacks, Git history, dashboards, and automation around it. I want the same operating model as the rest of the lab: declare the resource request, label the node, pin the runtime, check the rollout, observe the card, and keep the escape hatch obvious when I break something.
VM And Storage Shape#
The GPU worker is an extra Proxmox VM, not a bare-metal rebuild of the cluster. The control plane and the rest of the lab do not depend on that card. If the VM, passthrough, driver, or device-plugin layer gets weird, I can drain or rebuild the GPU worker without pretending the entire cluster is broken.
The sizing lesson was to keep the expensive parts separable: OS disk, model disk, vector disk, GPU passthrough, and Kubernetes scheduling contract.
Kubernetes can tell me what the scheduler sees, but it cannot replace checking the guest when the question is sizing:
| Guest signal | Live value |
|---|---|
| Kernel | 6.12.94+deb13-amd64 |
| CPU model | 11th Gen Intel Core i7-11700T |
| vCPU count | 16 |
That CPU number matters. The first shape around this node was smaller. It was enough to boot the model and prove passthrough, but later RAG and Qdrant planning made the failure mode obvious: 8 vCPU looked fine until requests left almost no operational headroom. So I treat sizing as something the platform can revisit, not as a trophy from first boot.
The storage layout is part of the design, not an implementation detail:
| Device | Guest size | Filesystem | Mount | Live usage |
|---|---|---|---|---|
system | 100G disk | ext4 | / | 100G total, 48G used, 45G free |
models | 200G disk | ext4 | /models | 200G total, 106G used, 82G free |
qdrant | 100G disk | ext4 | /qdrant | 100G total, 2G used, 98G free |
The model cache is not “some storage”. It is a separate local disk. Qdrant follows the same pattern on its own disk, so vector storage work does not share the model-cache mount.
Model Disk, Not Model Magic#
I do not want a 20 GB model download to be part of normal pod startup. I also do not want a random PVC to hide where the model cache lives.
The boundary is deliberately plain:
guest disk mount:        /models
chart hostPath:          /models/vllm
container mount:         /models
GGUF files in container: /models/gguf
GGUF files on the guest: /models/vllm/gguf
The llama.cpp chart does not rely on runtime -hf downloads. A prefetch job downloads and verifies exact GGUF files from a lock file. The server then
starts from a local path.
Sanitized from the values:
modelCache:
  hostPath:
    path: /models/vllm
    type: Directory
  mountPath: /models
  ggufDir: /models/gguf

prefetch:
  enabled: true
  modelFileRefs:
    - qwen36-35b-a3b-ud-q4-k-m
    - qwen36-27b-q4-k-m
The live pod sees the model disk like this:
$ df -h /models /models/gguf
Filesystem  Size  Used  Avail  Use%  Mounted on
/dev/sdb    197G  106G    82G   57%  /models
/dev/sdb    197G  106G    82G   57%  /models

$ ls -lh /models/gguf
16G  Qwen3.6-27B-Q4_K_M.gguf
21G  Qwen3.6-35B-A3B-UD-Q4_K_M.gguf
This is why disk growth stays below Kubernetes. Proxmox owns the virtual disk. The guest owns partition/filesystem growth and the stable mount. Helm only sees a host path that already exists.
The publishable guest-side pattern is:
# cloud-init / guest-side shape, sanitized
growpart:
  mode: auto
  devices: ["/"]

resize_rootfs: true

mounts:
  - [
      "/dev/disk/by-label/models",
      "/models",
      "ext4",
      "defaults,nofail,x-systemd.growfs",
      "0",
      "2",
    ]
  - [
      "/dev/disk/by-label/qdrant",
      "/qdrant",
      "ext4",
      "defaults,nofail,x-systemd.growfs",
      "0",
      "2",
    ]

runcmd:
  - mkdir -p /models/vllm/gguf /qdrant
And the actual mount contract in the guest is:
UUID=<models-uuid> /models ext4 defaults,noatime,nofail,x-systemd.growfs 0 2
UUID=<qdrant-uuid> /qdrant ext4 defaults,noatime,nofail,x-systemd.growfs 0 2
One uncomfortable but useful detail: cloud-init status currently reports an update_etc_hosts permission error on this VM. I am not hiding that, but
I am also not treating it as proof that model storage is broken. The mounts are active systemd mount units, /etc/fstab has the growfs contract, and the
LLM pod is reading GGUF files from /models. This is why I like checking boring layers separately.
The GPU Contract#
The first decision was to stop pretending that a single GPU can behave like a pool.
The rule is:
- exactly one GPU LLM lane is active at a time;
- inactive lanes stay parked at zero replicas;
- applications talk to LiteLLM, not directly to vLLM or llama.cpp;
- model switches run through a helper script with a preflight check;
- Argo CD owns the manifests, with selected replica drift allowed only for controlled GPU switches;
- GPU-critical runtime images are pinned by digest where the GitOps chart owns the release;
- model artifacts are locked by GGUF checksum or Hugging Face revision where reproducibility matters;
- GPU health is visible through Kubernetes scheduling state and DCGM.
That sounds strict for a homelab, but it removed ambiguity. The cluster does not have to guess which model owns the GPU, and clients do not have to know
which backend is active today. LiteLLM exposes stable aliases like fast, chat, agent, embed, rerank, and stt; the backend can move behind that.
RuntimeClass Is Not The GPU#
A GPU workload should say two different things clearly:
RuntimeClass/nvidiaselects the container runtime handler namednvidia.nvidia.com/gpu: 1asks Kubernetes for one GPU exposed by the NVIDIA device plugin.
Those are related, but they are not the same knob. RuntimeClass does not install the driver, does not create the GPU resource, and does not make the model fit in VRAM. The device plugin is the part that makes the GPU visible as an allocatable resource.
Sanitized from the llama.cpp values:
runtimeClassName: nvidia

resources:
  requests:
    cpu: "8"
    memory: 32Gi
    nvidia.com/gpu: 1
  limits:
    cpu: "14"
    memory: 64Gi
    nvidia.com/gpu: 1

nodeSelector:
  workload.ai/gpu: "true"

tolerations:
  - key: workload.ai/dedicated
    operator: Equal
    value: gpu
    effect: NoSchedule
Small Kubernetes detail that is easy to forget: GPUs are extended resources. For GPU resources, Kubernetes allows specifying only limits, or specifying
both requests and limits with the same value. That is why nvidia.com/gpu is 1 in both places here. CPU and memory can use different request and
limit values; the GPU count is not a burstable CPU-style budget.
The CPU values are deliberate. The VM is a 16 vCPU worker, and Kubernetes exposes 15 allocatable CPUs. requests.cpu=8 gives llama.cpp a real CPU budget
while leaving headroom for Qdrant and system daemons. limits.cpu=14 lets it burst close to the node size without pretending the rest of the node does
not exist.
The live deployment matches the contract:
replicas: 1
runtimeClassName: nvidia
nodeSelector:
  workload.ai/gpu: "true"
  kubernetes.io/hostname: "<gpu-worker>"
tolerations:
  workload.ai/dedicated=gpu:NoSchedule
resources:
  requests: cpu=8, memory=32Gi, nvidia.com/gpu=1
  limits:   cpu=14, memory=64Gi, nvidia.com/gpu=1
volumes:
  /models   <- hostPath /models/vllm
  /dev/shm  <- memory emptyDir, 8Gi
The worker runtime path also matches the manifest instead of only looking right on paper:
containerRuntimeVersion: containerd://2.2.3-k3s1
RuntimeClass/nvidia:
  handler: nvidia
allocatable:
  nvidia.com/gpu: 1
The model command is intentionally visible in the pod spec:
-m /models/gguf/Qwen3.6-35B-A3B-UD-Q4_K_M.gguf
--alias qwen36-35b-gguf-fast
--ctx-size 49152
--cache-type-k q8_0
--cache-type-v q8_0
--n-gpu-layers 999
--flash-attn on
--parallel 1
--jinja
--host 0.0.0.0
--port 8080
--metrics
The generated Deployment carries two details I do not want to forget:
metadata:
  labels:
    platform.example.com/gpu-llm: "true"
  annotations:
    ai.example.com/model-file-sha256: "<locked GGUF sha256>"
    ai.example.com/model-file-size-bytes: "<locked file size>"
spec:
  strategy:
    type: Recreate
  revisionHistoryLimit: 2
  template:
    spec:
      automountServiceAccountToken: false
      enableServiceLinks: false
Recreate is intentional. I only have one GPU and one serving replica, so pretending this can roll like a normal stateless Deployment would be misleading.
The model pod has to release the GPU before the next one can take it.
NVIDIA Device Plugin As A Production Dependency#
The NVIDIA device plugin is not just “the thing that makes GPUs appear”. In a single-card cluster, it is part of the admission path for the most important workload.
This section is intentionally NVIDIA-specific. The part that generalizes is the pattern: vendor device plugin, explicit resource request, runtime wiring, node labels, and telemetry. The exact resource names, labels, sharing modes, and operational traps are vendor details.
The production overlay pins the device plugin image by tag and digest, uses runtimeClassName: nvidia, enables GPU Feature Discovery and Node Feature
Discovery, and schedules only onto GPU-labelled nodes.
This is a live snapshot, not a version recommendation. Newer k3s or NVIDIA device-plugin releases may exist by the time this post is published. I pin GPU-node components deliberately and upgrade the device plugin separately from the model runtime.
Sanitized from the overlay:
runtimeClassName: nvidia

image:
  tag: "v0.19.2@sha256:<pinned-digest>"

devicePlugin:
  enabled: true
gfd:
  enabled: true
nfd:
  enabled: true

migStrategy: none
failOnInitError: true
deviceListStrategy: envvar
deviceIDStrategy: uuid

nodeSelector:
  workload.ai/gpu: "true"

tolerations:
  - key: CriticalAddonsOnly
    operator: Exists
  - key: nvidia.com/gpu
    operator: Exists
    effect: NoSchedule
  - key: workload.ai/dedicated
    operator: Equal
    value: gpu
    effect: NoSchedule
The labels I care about are semantic rather than accidental:
workload.ai/gpu=trueworkload.ai/gpu-tier=supportworkload.ai/vram=24gbworkload.ai/profile=inference
Future hardware should not require rewriting every workload. A bigger card can become gpu-tier=big or profile=brain. The current 24 GB card can later
stay as a support accelerator.
The device plugin settings are conservative:
- no MIG;
- no MPS in production for the active chat lane;
- environment variable device list strategy;
- UUID-based device identity;
- fail on init error.
The last one matters. If the device plugin cannot initialize the GPU, I want the system to fail loudly. Quiet partial success is worse than a hard failure when the only GPU is the resource under test.
Here is the live node evidence, sanitized to remove the node name:
role: ai-worker
status: Ready
version: v1.35.5+k3s1

taints:
  - workload.ai/dedicated=gpu:NoSchedule

capacity:
  cpu: "16"
  memory: "61653804Ki"
  nvidia.com/gpu: "1"
  pods: "110"

allocatable:
  cpu: "15"
  memory: "57457452Ki"
  nvidia.com/gpu: "1"
  pods: "110"

conditions:
  Ready: "True"
  MemoryPressure: "False"
  DiskPressure: "False"
  PIDPressure: "False"
These are the useful GPU labels from GFD/NFD:
workload.ai/enabled: "true"
workload.ai/gpu: "true"
workload.ai/gpu-family: blackwell
workload.ai/gpu-model: rtx-pro-4000-blackwell-sff
workload.ai/gpu-tier: support
workload.ai/gpu-vendor: nvidia
workload.ai/profile: inference
workload.ai/vram: 24gb

nvidia.com/gpu.product: NVIDIA-RTX-PRO-4000-Blackwell-SFF-Edition
nvidia.com/gpu.family: blackwell
nvidia.com/gpu.count: "1"
nvidia.com/gpu.memory: "24467"
nvidia.com/gpu.compute.major: "12"
nvidia.com/gpu.compute.minor: "0"
nvidia.com/gpu.sharing-strategy: none
nvidia.com/gpu.replicas: "1"
nvidia.com/mig.capable: "false"
nvidia.com/mps.capable: "false"
nvidia.com/vgpu.present: "false"
nvidia.com/cuda.driver-version.full: "610.43.02"
nvidia.com/cuda.runtime-version.full: "13.3"
The guest-level nvidia-smi snapshot says the same thing in a lower-level way:
name: NVIDIA RTX PRO 4000 Blackwell SFF Edition
driver: 610.43.02
memory.total: 24467 MiB
memory.used: 21642 MiB
memory.free: 2386 MiB
power.limit: 70 W
power.draw: about 9 W while idle
temperature: 37 C
current PCIe link: gen1 x8 while idle
nvidia-container-runtime: 1.19.1
The PCI view from inside the VM is also useful:
<passed-through-vga> VGA compatible controller:
  NVIDIA Corporation GB203GL [RTX PRO 4000 Blackwell SFF Edition]
  Kernel driver in use: nvidia
  Kernel modules: nouveau, nvidia_drm, nvidia

<passed-through-audio> Audio device:
  NVIDIA Corporation GB203 High Definition Audio Controller
  Kernel driver in use: snd_hda_intel
The gen1 x8 value is the current idle link state, not the whole passthrough story. What I care about in daily operations is that the driver, container
runtime, GFD labels, device-plugin allocation, and DCGM metrics all describe the same card.
Serving Lanes#
The names in this stack sound similar, but they describe different layers.
An LLM is the model itself: weights and tokenizer. In this post, the active model is a Qwen GGUF file on the local /models disk. GGUF is the model-file
format used by llama.cpp, and the Q4 file is small enough to fit this 24 GB card with the context settings I actually use.
llama.cpp is the server/runtime. It loads the GGUF file, puts as much work as possible on the NVIDIA GPU, exposes HTTP, and reports metrics. This is the active lane because it is boring in the useful way: model file in, server up, health check green, predictable VRAM use.
vLLM is another serving engine. It is excellent for high-throughput serving patterns, and I keep profiles for it in Git. I just do not make it the default on this card. One 24 GB GPU can be a good local inference lane, but it is not an infinite model platform.
LiteLLM sits one layer higher. Clients ask for fast or agent; they do not hardcode qwen36-35b-gguf-fast or a Kubernetes service name. Backend churn stays behind the gateway.
The lane table is the important part. Parked GPU deployments still declare nvidia.com/gpu: 1, but at replicas=0 they do not consume the card:
| Lane | Replicas | Runtime | GPU request/limit |
|---|---|---|---|
qwen36-35b-gguf-fast | 1 | nvidia | 1 / 1 |
qwen36-35b-gguf-longctx | 0 | nvidia | 1 / 1 |
qwen36-27b-deep | 0 | nvidia | 1 / 1 |
qwen36-nvfp4-experiment | 0 | nvidia | 1 / 1 |
gpt-oss-agent | 0 | nvidia | 1 / 1 |
vllm rollback | 0 | nvidia | 1 / 1 |
This is where the design changed after first success. At first, “GPU pod runs” looked like the finish line. It was not. After that came labels, taints, parked lanes, preflight checks, digest pins, model locks, DCGM panels, and the rule that device-plugin updates do not get mixed with model runtime updates.
What I Tried And Did Not Keep#
I looked at the usual ways to share the card more aggressively:
- MIG: not useful for this card and this workload shape.
- MPS: attractive on paper, but the active chat model already uses most of the 24 GB card.
- time-slicing: possible as a stopgap, but it gives scheduling fairness, not real memory isolation.
- embeddings or STT on the same card: too tight until a second GPU exists.
It is easy to draw a nice “AI platform” where chat, embeddings, reranking, STT, and tools all share one GPU. The failure mode is simple: the first large chat model eats the card, and the rest of the diagram becomes wishful thinking.
So I kept the 24 GB card as one active LLM lane and moved the rest of the system around that fact.
Drift Caught While Writing#
This post caught a real mistake.
While checking the article, I found that the VM and Kubernetes were already at 16 vCPU, but the llama.cpp GitOps values still carried the older CPU budget. The live node had grown, but the workload contract still described the previous shape.
The fix was deliberately not “give the model everything”:
VM sizing:              16 vCPU, 58Gi RAM
Kubernetes allocatable: 15 CPU, about 54.8Gi RAM
llama.cpp request:       8 CPU, 32Gi RAM, 1 GPU
llama.cpp limit:        14 CPU, 64Gi RAM, 1 GPU
The node allocation after the fix is the sanity check:
| Resource | Requests | Limits |
|---|---|---|
| CPU | 10755m / 71% | 18100m / 120% |
| Memory | 43072Mi / 76% | 75Gi / 136% |
| GPU | 1 | 1 |
I am fine with CPU and memory limits being over 100% on this homelab node. I am not fine with requests silently consuming the entire node. That is the difference between overcommit and a scheduling trap.
The Maintenance Trap#
The strongest operational lesson came from a normal-looking update.
I had two changes ready:
- update the NVIDIA device plugin from one pinned release to the next;
- refresh the llama.cpp CUDA server image digest.
On paper these are separate layers. In practice, rolling both during the same window on one GPU is risky. The device plugin can temporarily unregister or re-register the GPU while the model pod is also being recreated.
That is how you get an UnexpectedAdmissionError class of failure: Kubernetes tries to admit the model pod while the device plugin has no healthy device
to allocate.
The fix is simple:
- update the NVIDIA device plugin first;
- wait until the node reports GPU capacity and allocatable count correctly;
- watch for stability;
- only then roll the model runtime image in a separate window.
That split is now part of the runbook. It looks boring only after it saves you from a messy rollback.
Preflight Before Scale-Down#
The model switch helper evaluates the target lane before it scales down the currently serving model. On a one-GPU system, the current model is also the rollback. If I tear it down before discovering that the target cannot fit or cannot start, I created my own outage.
The preflight checks:
- target model profile;
- GPU labels and node selectors;
- whether the target needs one or more GPUs;
- known broken profiles;
- live GPU state when a running GPU pod is available;
- likely quantization and memory fit;
- ambiguous or missing placement labels.
The exit codes are explicit:
0means pass;10means warn;20means block.
A warning can be forced for a deliberate experiment. A block stops the switch before the current model is touched.
This is the happy path, sanitized:
GPU fit preflight: PASS fast
gpu: NVIDIA RTX PRO 4000 Blackwell SFF Edition, total=24467MiB
lane: qwen36-35b-gguf-fast, runtime=llamacpp
fit: ctx=49152, quant=Q4_K_M, live_peak_mib=21648
checks:
  [PASS] gpu_inventory: cluster exposes one allocatable GPU
  [PASS] model_lock: GGUF file is locked with sha256 and sizeBytes
  [PASS] prefetch_config: modelFileRef is listed in prefetch config
  [PASS] kv_cache_type: K/V cache types modeled as q8_0/q8_0
  [PASS] validated_live_peak: fast lane has acceptance evidence on this GPU
decision: PASS
And this is the kind of block I want before any scale-down happens:
GPU fit preflight: BLOCK nvfp4
lane: qwen36-nvfp4-experiment, runtime=vllm
checks:
  [BLOCK] known_broken: vLLM rejects this checkpoint with lm_head.input_scale
          model-class mismatch; this is not an OOM.
  [WARN] validation_status: no successful load/serve validation is recorded
  [BLOCK] cache_prefetch: model is not prefetched
decision: BLOCK; do not scale the GPU lane.
The switch script is written around that contract:
scripts/llm-fit-preflight.py fast --namespace vllm
kubectl -n vllm scale deployment/vllm \
  deployment/qwen36-35b-gguf-longctx \
  deployment/qwen36-27b-deep \
  --replicas=0
kubectl -n vllm scale deployment/qwen36-35b-gguf-fast --replicas=1
The real script discovers which known deployments exist, waits for rollout completion, and checks the invariant at the end: exactly one running GPU LLM pod and zero pending GPU LLM pods. The important part is ordering. The preflight runs before the current model is touched.
I also test that ordering:
python -m pytest \
  tests/test_switch_gpu_llm.py \
  tests/test_llm_fit_preflight.py \
  tests/test_nvidia_device_plugin.py \
  tests/test_llamacpp_gpu_digest.py \
  -q

26 passed in 1.44s
Measured Runtime Behavior#
The production llama.cpp lane is not just assumed to be good. It has measured behavior.
These numbers are not meant to be a generic benchmark for the model or the GPU. They are acceptance evidence for this exact lane: this model file, this runtime image, this context setting, this gateway path, and this 24 GB card.
The method was small but explicit:
- measure direct llama.cpp behavior and the LiteLLM
fastalias separately; - keep the gateway path in the numbers because clients do not call the backend directly;
- run a short decode test around 2K context;
- run a longer decode test around 40K context;
- run a cold prefill test around 30K context and record TTFT.
Representative numbers from the June 2026 runbook:
| Path | Result |
|---|---|
| Direct llama.cpp chat smoke | about 96.7 tokens per second |
LiteLLM fast alias | about 88.7 tokens per second |
| Decode around 2K context | about 83.9 tokens per second |
| Decode around 40K context | about 58.9 tokens per second |
| Cold prefill around 30K context | about 1819 prompt tokens per second |
| Cold TTFT around 30K context | about 16.8 seconds |
The context-length numbers matter. A model that looks fast on a tiny prompt can feel very different when it has to read a handoff, a runbook, and a diagnostic log excerpt in the same request.
I also keep the model gateway in the measurement path. Direct backend performance is useful for debugging, but users and tools call LiteLLM. The gateway overhead is part of the production experience.
Observability Around The GPU#
The GPU lane is monitored as an application, not as a screenshot from nvidia-smi.
DCGM exporter provides the GPU telemetry I actually want in dashboards:
- framebuffer memory used and free;
- GPU utilization and memory-copy utilization;
- temperature;
- power draw;
- clocks;
- PCIe counters;
- Xid errors;
- throttling signals.
The AI stack also has application-level checks:
- LiteLLM model aliases are probed;
- chat, tool calling, embeddings, rerank, and STT routes have active checks;
- model pod restart count is treated as a sentinel;
- the “exactly one GPU LLM” invariant is recorded;
- the active model
/healthpath is checked independently from metrics scraping.
This separation helped in practice. A model can be serving while a direct scrape target is misconfigured. A scrape target can be green while the user-facing alias is wrong. I want to know which layer failed.
This is the public-safe snapshot I would include rather than a raw Grafana screenshot with private labels:
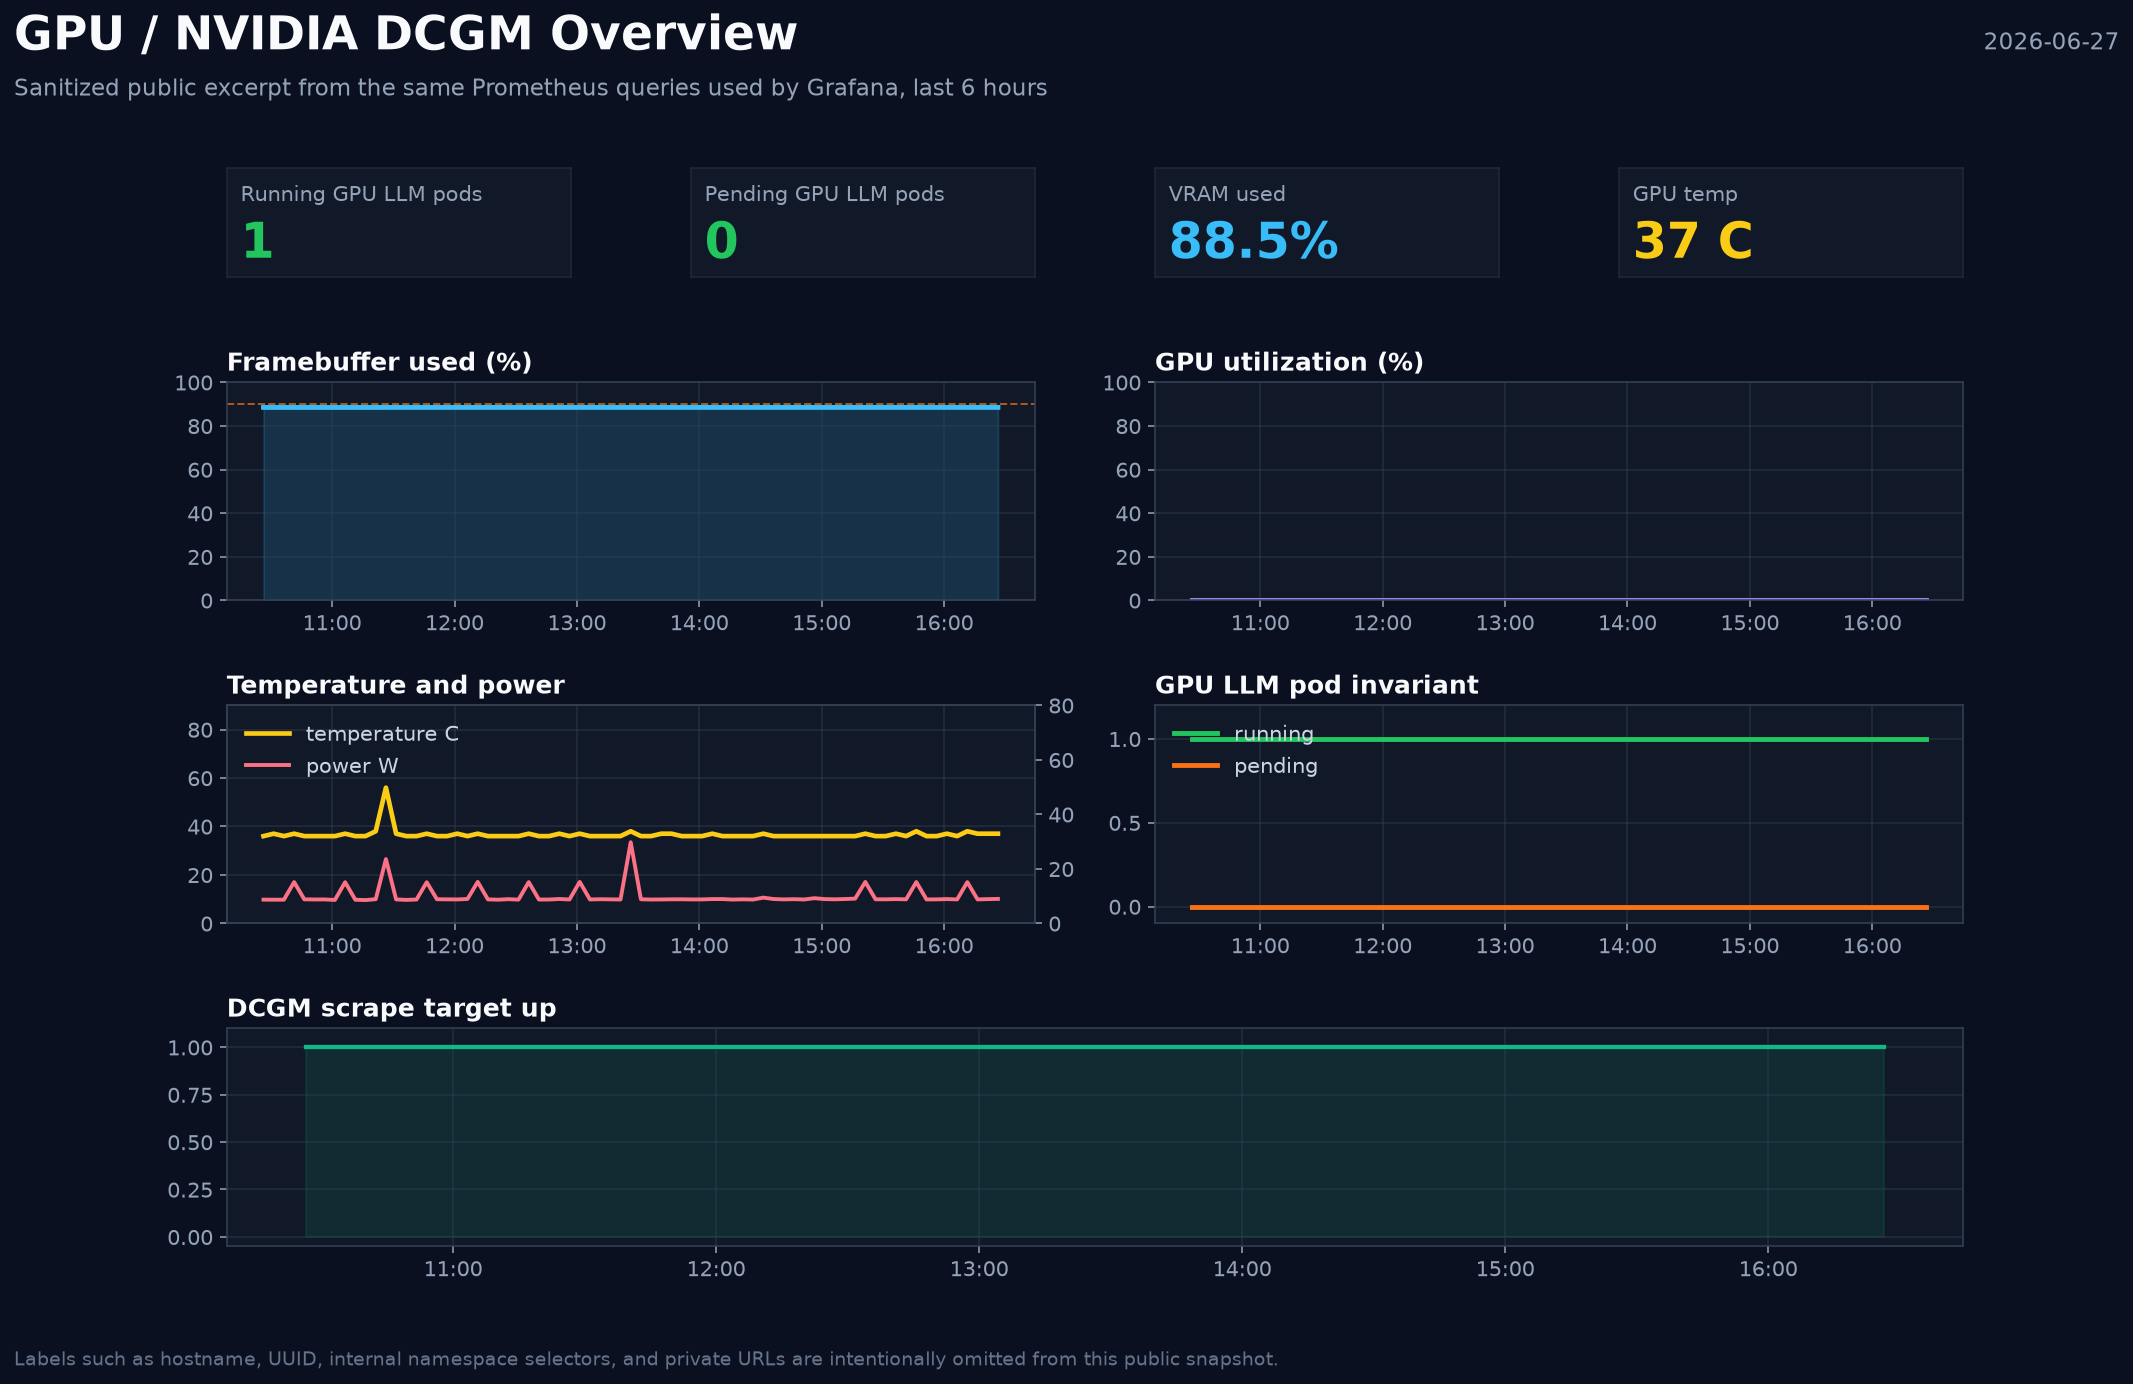
The real dashboards are GPU / NVIDIA DCGM Overview and AI / Inference Operational Overview. The Grafana Image Renderer plugin is not installed in my
instance, so this image is not a native Grafana PNG export. I exported the panel queries, queried Prometheus through the same datasource, and rendered this
sanitized excerpt without hostname, UUID, or internal URL labels.
The picture is still useful evidence. It shows the invariant I care about: one running GPU LLM pod, zero pending GPU LLM pods, DCGM scraping up, and VRAM already mostly occupied even when GPU utilization is idle. That last bit is the point of the post. The card can look quiet and still be owned.
One live example: at 19:33, kubectl top showed the node using almost no CPU and the active model pod using very little normal container memory, while
nvidia-smi still showed about 21.6 GiB of VRAM used. That is why I do not use CPU/RAM metrics as a proxy for GPU ownership. The quiet card was still the
owned card.
What I Would Fix Next#
The system is usable, but a few things are still worth tightening:
- test and record PCIe link behavior under real load, not only the idle
gen1 x8snapshot; - keep watching CPU request headroom as Qdrant moves from an empty disk to a real workload;
- keep the 24 GB card as a support/inference lane if a larger “brain” GPU joins the lab later.
What I Would Repeat#
The decisions I would keep are:
- put LiteLLM in front of everything;
- pin GPU-critical images by digest;
- use semantic GPU labels;
- keep one active GPU LLM on a 24 GB card;
- make parked lanes explicit;
- run preflight before scale-down;
- treat device plugin updates as GPU maintenance, not just a DaemonSet rollout;
- measure the gateway path, not only the backend.
The bigger lesson is that a homelab can borrow production habits without becoming joyless. The point is not ceremony. The point is keeping experiments reversible.
When there is only one GPU, the honest abstraction is not “a GPU cluster”. It is a scarce accelerator with a contract. Once I started treating it that way, the system became much easier to reason about.