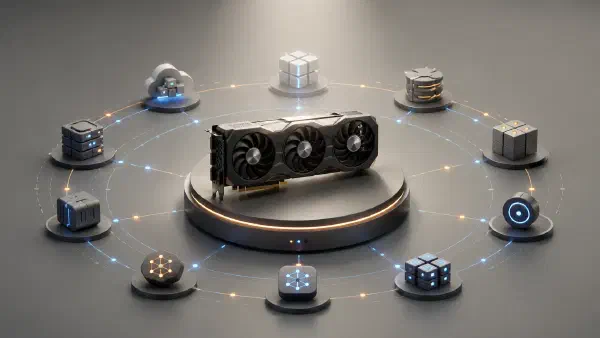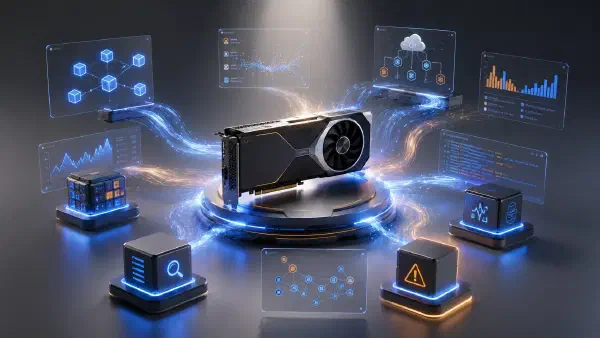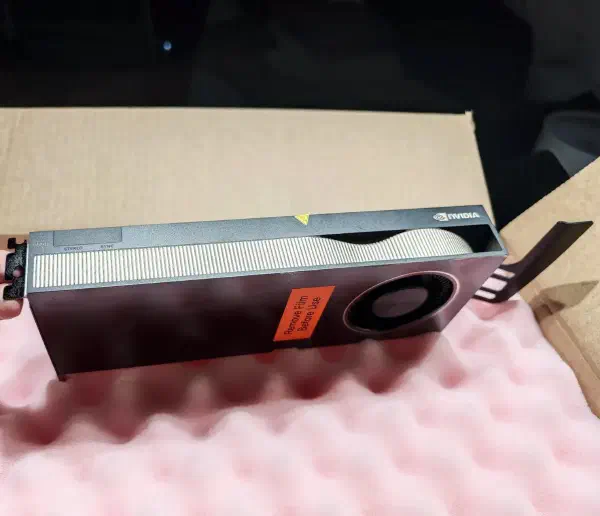
I wanted to dictate long thoughts without taking my 24 GB NVIDIA card away from the language model running on it. The CPU speech service already ran faster than realtime, but used about five and a half cores to do it. Meanwhile, four Intel Iris Xe integrated GPUs, one in each of my fanless mini-PC Proxmox nodes, sat mostly idle.
That was the reason to try integrated graphics: I already had them. Moving speech recognition to existing hardware was more interesting than giving another job to the same busy accelerator.
Whisper through OpenVINO on those iGPUs replaced the CPU service, drawing about one CPU core per transcription instead of five and a half. Getting there involved PCI passthrough, Kubernetes placement, GPU contention, and a queue that could let a long recording delay an otherwise quick request. Several attractive early numbers also turned out to answer the wrong question.
This is Part 1 of 4 in my speech-to-text series. Here I follow the hardware and serving path. Part 2 covers custom images and releases, Part 3 examines recognition quality, and Part 4 follows audio from the browser microphone to the finished prompt.
The device had to reach the model#
The final recognizer is Whisper large-v3-turbo, running through OpenVINO on Intel Iris Xe. The model is stored with INT8 weight compression; that does not mean every activation or operation runs in INT8. On the GPU, beam search failed as not implemented in the OpenVINO GenAI version I ran, so my backend refuses it and decodes greedily: at each step it keeps only the most likely next token, instead of a beam of several candidate transcripts.
Callers kept an ordinary OpenAI-compatible transcription API.
Open WebUI, my chat front end, sent a recording through
LiteLLM, my model proxy, to my STT gateway under the stt or
whisper-1 model alias. The less ordinary part sat below that API:
flowchart TB
A[Physical Intel Iris Xe] --> B[Proxmox PCI passthrough]
B --> C[Linux guest: i915]
C --> D["Kubernetes
device allocation"]
D --> E["Container userspace
driver and OpenCL"]
E --> F["OpenVINO
Whisper worker"]
Each layer needed its own check.
Proxmox VE
passed the PCI device to a virtual machine, whose guest had to load i915 and expose the
render device. The Intel GPU device plugin
had to advertise gpu.intel.com/i915 to Kubernetes, and the serving container needed a
compatible userspace driver and access to that allocated device.
Seeing a PCI device in the guest does not establish that the container can compile and execute a model on it. OpenVINO’s Linux GPU setup requires the OpenCL runtime as well as the correctly configured graphics driver. The useful proof was an actual decode on the intended GPU.
Each Whisper worker currently requests one GPU allocation from the device plugin, two CPU cores and 5 GiB of memory, with limits of eight cores and 8 GiB. Required Pod anti-affinity places those replicas on separate nodes. A fixed replica count reflects the number of physical cards I can assign to this job.
Four cards, then two different jobs#
The measurements in this part span the service’s growth from two to four final-transcription workers. Today I use three cards for final transcription and dedicate the fourth to a separate live-preview service. That preview runs Qwen3-ASR-0.6B, while Whisper still produces the final text.
| Role | Hardware today | What its text means |
|---|---|---|
| Final transcription | Three Iris Xe cards, one Whisper replica per card | Complete recording decoded after Stop |
| Live preview | One Iris Xe card, one Qwen replica | Replaceable draft from the latest audio window |
The preview works on the latest six seconds rather than continually appending an authoritative transcript of the whole recording. Open WebUI retains the full audio for the final request. The browser-facing details matter enough to have their own part.
The measurements below belong to the earlier final-worker experiments. They are useful evidence about contention, warmup and routing; they do not measure the total capacity of the later three-final/one-preview arrangement.
Two allocations still shared one GPU#
My device plugin advertises two allocations per card. That made room for a temporary experimental worker alongside the resident one. It did not create a second physical accelerator.
Speed in this post means audio duration divided by processing time: 10x realtime means roughly ten seconds of audio processed per second. In the sharing experiment, on a 25-second clip of synthesized Russian speech, the resident worker fell from 11.96x realtime to 5.67x. Both workers together delivered about 10.9x realtime, below the resident worker’s solo result. The experiment measured the slowdown; it did not isolate its hardware or runtime cause.
Sharing was useful for bounded experiments, with an obvious cost to the existing service. It was a poor basis for promising twice the production capacity. The current preview reserves both advertised allocations on its card to keep that physical GPU exclusive to its own workload.
Full nodes blocked a rollout#
Memory caused a different placement failure. During an early rollout, each worker
requested 4 GiB and the nodes already had 85-92% of allocatable memory committed.
The Deployment’s rolling update allowed one surge Pod but no unavailable old replica
(maxUnavailable: 0), so it had to start a new Pod before stopping an old one. The new
Pod stayed Pending because there was nowhere to put it.
Setting maxUnavailable: 1 let the controller retire an old worker first.
Increasing the surge allowance would not have supplied the missing memory. The change
traded a temporary reduction in serving capacity for a rollout that could progress.
A fast model can sit behind a slow queue#
Each final replica performs one transcription at a time. My current limits distinguish the stages of a request:
| Boundary | Limit | Purpose |
|---|---|---|
| Waiting requests | Four per worker | Bound backlog behind active inference |
| Queue wait | 120 seconds | Stop waiting for capacity indefinitely |
| Worker execution | 380 seconds | Bound work after admission |
| Upload | 256 MiB | Bound the incoming file |
| Declared audio duration | 2,400 seconds | Reject known over-limit recordings early |
The duration check reads the duration that the audio file’s own header declares, using ffprobe, before taking a worker slot. If duration cannot be read, that check cannot reject it; the upload and execution limits remain separate controls. A forty-minute limit is therefore a documented service budget, not a guarantee that every possible forty-minute recording will finish.
I derived it from the rate my sizing calculation treated as its worst case: 380 seconds times 10.83x realtime, multiplied by a 0.6 safety factor, gives about 2,469 seconds of audio. I rounded down to 2,400. It was not the slowest rate I measured: a 60-second recording ran at about 9.2x, and sharing a card roughly halved a worker’s speed. The assumptions matter as much as the round number.
Retries needed the same care. A request rejected before inference starts and a transcription that has already exhausted its execution deadline are different cases. Blindly replaying the latter pays for the expensive work again.
Routing also determined who waited. A Kubernetes Service distributed connections without knowing which worker was already processing a long file. In a controlled comparison, two of nine short requests queued behind the occupied worker. The worst took 7.71 seconds, against about 2.1 seconds for an unblocked request.
An Envoy proxy with least-request load balancing, configured through Cilium, changed that. In a shadow run, through a temporary Service with the same selector and no production traffic, all nine short requests finished in 2.06-2.16 seconds. After the switch, the same test through the production Service gave 2.05-2.17 seconds. The proxy considered outstanding requests when selecting a worker; it did not make Whisper itself faster.
flowchart TB
A["Final recording
via LiteLLM"] --> B[Least-request proxy]
B --> C["Worker admission
and queue"]
C --> D["One active
Whisper decode"]
D --> E[Final transcript]
The shadow run was my second attempt. The first deployment went straight to the production Service and returned errors for about four minutes, because one missing field kept the proxy from finding its endpoints, despite green Argo CD health. A transcription through the caller’s actual route exposed what a healthy controller status could not.
A later operational check sent a 2,395-second recording through the least-request proxy. It completed in 213 seconds, about 11.2x realtime, while a concurrent short clip returned in 2.2 seconds. A separate 2,400.5-second input was rejected before taking a worker slot. This checked long-file handling, concurrent routing and the known-duration boundary. It did not measure the long transcript’s word error rate: substituted, dropped and inserted words as a share of the words in a reference transcript.
The speed comparison needed its own repair#
My first CPU and GPU figures used different recordings. Dividing audio duration by wall time did not make them comparable: short clips pay fixed overhead differently, while silence, chunk boundaries and decoding settings change the work.
The corrected historical comparison, on the same real Russian recordings, supported replacing the deployed CPU service:
| Historical service | Speed | CPU use |
|---|---|---|
| CTranslate2 CPU deployment | 2.0-3.4x realtime | About 5.5 cores |
| OpenVINO Iris Xe deployment | 9.2-11.7x realtime | About 1 core |
These were two service configurations, including different beam-search and voice-activity detection settings. They answered whether the replacement helped my deployment. They did not isolate the effect of changing only the processor.
A later paired accuracy check used the same 155 clips on CPU and GPU with greedy decoding: every fifth clip of the 775-clip FLEURS Russian test set, which is read speech. Both scored 4.94% word error rate after Russian-specific text normalization, with 144 transcripts byte-identical. Its recorded speed summaries covered different denominators, however: the 155 CPU clips versus all 775 on the GPU. I could compare those paired transcripts, but could not turn the two speed summaries into another acceleration ratio.
Warmup mattered too. On the same 25-second synthesized clip, the first OpenVINO request ran near 7.5x realtime and the second near 9.7x before settling around 12.2-12.4x. I attribute that to OpenVINO compiling GPU kernels on first use. Two warmup decodes at startup removed the penalty: afterwards the first request ran at about 12x, for five extra seconds of startup. Loading the weights alone had not prepared the worker for its first useful request.
The dashboard needed similar scrutiny. Over one day, a synthetic prober’s two-second test clips accounted for 695 of 707 transcriptions. A combined speed summary near 2.9x mostly described that prober, while real transcriptions were around 10-11x. I separated useful traffic from synthetic checks, and queue wait from inference time.
What the integrated GPUs bought me#
I gained a separate place to run speech recognition with hardware already in the rack. The language model kept its NVIDIA card, a 2,395-second recording finished in 213 seconds, and a transcription drew about one CPU core instead of five and a half. The useful improvements came from the whole path: a working render device, compatible inference software, warm workers, bounded admission and routing that avoided a busy replica.
How the service changed:
- CPU: CTranslate2 at 2.0-3.4x realtime, about 5.5 cores per transcription.
- First GPU lane: Whisper through OpenVINO on two, then four Iris Xe cards, warmed at startup.
- Request path: least-request routing, a bounded queue and a forty-minute duration budget.
- Current split: three Whisper final workers and one Qwen3-ASR preview card.
The corrections were as valuable as the tuning: a second allocation was not a second GPU, a ready Pod was not a completed transcription, and a dashboard average was not the speed of real dictation.
Claude Code helped with the original warmup, sharing, routing and benchmark analysis, and later made the gateway recognize the prober by its audio clip. Codex added the first label for probe traffic and the first deadline-based sizing of the duration limit.
Keeping that path working across upgrades became the next problem. Part 2 follows the custom container images, model artifacts and release checks that made it maintainable.