I bought a 96 GB GPU at a price I was happy with, before prices went up. I am keeping the number to myself. Getting it into the rack was the beginning of several weeks of model comparisons, runtime fixes and, eventually, a different motherboard.
The result is one Proxmox host with two Blackwell cards, two K3s worker VMs, and a large language model serving real requests. This is the path from the original plan to that working setup, including the checks that turned out to be wrong.
Just here for the procedure? Jump to the complete onboarding checklist.
Why I chose the 300 W RTX PRO 6000#
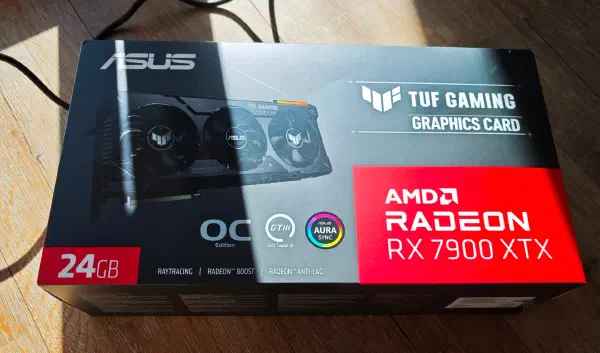
The exact card is the NVIDIA RTX PRO 6000 Blackwell Max-Q Workstation Edition. It joined the RTX PRO 4000 Blackwell SFF Edition from my earlier GPU-node build. The edition names matter: both are Blackwell cards, but their power, memory and PCIe interfaces differ.
| Specification | RTX PRO 6000 Blackwell Max-Q | RTX PRO 4000 Blackwell SFF |
|---|---|---|
| GPU memory | 96 GB GDDR7 with ECC | 24 GB GDDR7 with ECC |
| Memory bandwidth | 1,792 GB/s | 432 GB/s |
| CUDA cores | 24,064 | 8,960 |
| Total board power | 300 W | 70 W |
| PCIe interface | Gen5 x16 | Gen5 x8 |
| Form factor | Full height, dual slot, 10.5 inches long | Half height, dual slot, 6.6 inches long |
| Cooling | Active | Active |
These are NVIDIA’s published specifications, from the Max-Q datasheet and SFF datasheet, not measurements of my workloads. Memory bandwidth is local to the GPU; it is separate from PCIe bandwidth. The exact Max-Q also has a TechPowerUp database entry for a supplementary reference.
The standard RTX PRO 6000 Blackwell Workstation Edition has a 600 W power budget. Both editions have 96 GB of GDDR7 ECC memory and 1,792 GB/s memory bandwidth. NVIDIA lists 110 versus 126 TFLOPS FP32, and 3,511 versus 4,000 effective FP4 AI TOPS with sparsity, for Max-Q versus Workstation. Those are peak specifications at GPU Boost clocks. The larger Workstation card uses double-flow-through cooling; NVIDIA describes Max-Q’s cooling as active.
There is also a separate Server Edition. My Max-Q is a workstation card. The listed performance gap did not justify a 600 W heat budget in my home setup: I wanted the 96 GB capacity, and the 300 W tradeoff made sense to me. I have not benchmarked both editions, so that choice is not a claim that they perform equally.
The plan before delivery#
Before the card arrived, I asked OpenAI Codex and Anthropic Claude Code to research the migration and review each other’s conclusions. We already had experience with the 24 GB card. The questions were what could move to 96 GB, what should stay on 24 GB, and how the cluster would change once both were available.
The first idea was to keep several model services resident on the large card and advertise multiple scheduling slots through time slicing. The revised baseline gave one main language-model engine the whole card, compared checkpoints one at a time, and kept the 24 GB card as a support tier. Extra scheduling slots do not create more VRAM or isolate one model’s allocations from another’s.
One old assumption survived into the arrival checklist: it still expected eight time-sliced slots, although the accepted plan required one. I corrected it during onboarding. The shortlist had also changed, with newer GLM and T-pro checkpoints and a Gemma candidate. The research was useful, but the installed configuration still needed to be checked against the decision it was meant to implement.
One host, two cards, and an actual slot budget#
The GPUs started in separate physical hosts. The 96 GB card was on a Gigabyte Z790 AORUS board; the 24 GB card had its own host. I wanted to consolidate them, but the AORUS layout did not leave room for a second GPU at a useful link alongside the 10 GbE adapter connecting my hosts. Slot spacing and electrical wiring both counted. Another full-length slot is not necessarily another useful GPU slot.
I replaced the Gigabyte AORUS board with an ASUS Pro WS W680-ACE, keeping the CPU and memory. I also moved the build into a Chieftec rack case with 120 mm fans to give cooling proper attention.
Power needs its own checklist#
The Max-Q needs a PCIe CEM5 16-pin auxiliary power connection. NVIDIA’s installation guide specifies the included NVIDIA adapter, fed by two separate PCIe 8-pin cables from the PSU. Follow that connection procedure, use cables compatible with the exact PSU, and check the complete system power budget. The GPU-end connector must be fully seated.
My first PSU and adapter combination did not get the card working. Replacing that setup with a Seasonic PSU did. I did not isolate whether the original fault was the PSU, adapter or connection, so I cannot turn that experience into a rule that adapters do not work. The 70 W RTX PRO 4000 SFF had required no such cable: NVIDIA’s installation guide confirms that it takes no auxiliary power connection.
The ASUS board has another connector worth noticing: its six-pin PCIE_6P_PWR supplies additional
power to the PCIe slots. It serves a different purpose from the GPU’s own 16-pin input; the
motherboard manual documents it in the power-connectors section.
The plain Pro WS W680-ACE also supports an optional IPMI expansion card, sold separately. I already use PiKVM for remote console access, so that option was not a reason to buy the board.
The consolidated build#
Both cards now share one Proxmox host. Each is passed through to its own K3s worker VM, and the former host for the smaller card is powered off. Consolidation makes the physical setup simpler, but it also puts both GPU services in one failure domain: two VMs do not provide protection from maintenance or failure of their shared host.
After the move, Proxmox reported roughly 93% host memory utilization, enough to fire the high-memory alert. That makes host capacity part of the next tuning pass as well.
The resulting build:
| Component | Current build |
|---|---|
| Motherboard and firmware | ASUS Pro WS W680-ACE, AMI BIOS 4601 |
| CPU | Intel Core i7-13700T, 16 cores / 24 threads |
| Host memory | 192 GB: four 48 GB DDR5 modules, running at 4200 MT/s, non-ECC |
| Hypervisor | Proxmox VE 9.2 |
| GPU guests | Two VMs, each with 60 GiB RAM, q35, OVMF and host CPU type |
Memory ballooning is disabled for both GPU guests. The cards are assigned as PCIe devices; the inspected VM configurations do not contain a custom QEMU MMIO-window override.
What matters is how the slots are wired. The ASUS manual specifies two CPU-connected PCIe 5.0 slots: one card in the first slot gets x16; two cards run x8/x8. The other full-length slots are chipset-connected PCIe 3.0 x4. Choosing either of those would be a very different configuration.
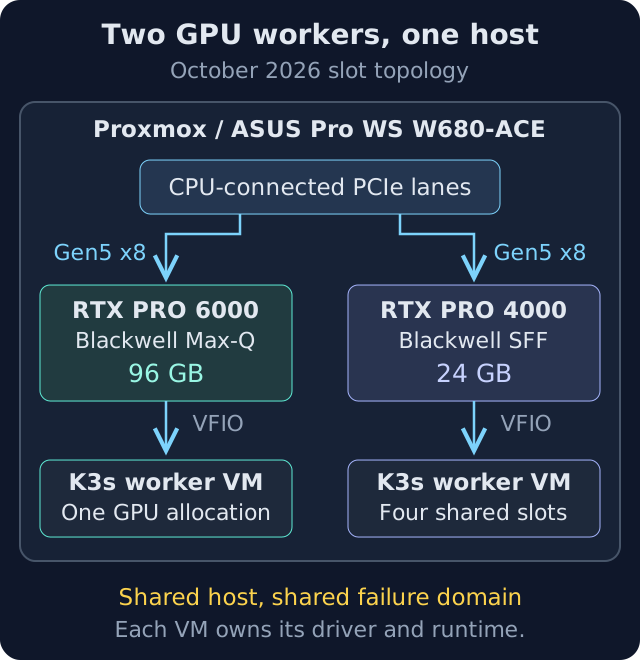
The host inspection confirmed two CPU-connected ports, each capable of Gen5 x8. Both links were at idle Gen1 x8 when read. Retained GPU telemetry also records Gen5 x8 after the move.
Open the topology diagram at full size.
This is why I bought the board. It can keep both cards on CPU-connected Gen5 links in the intended slots. NVIDIA specifies the SFF card’s interface as Gen5 x8, so that layout supplies its full specified width; the Max-Q card uses eight of its sixteen supported lanes. Intel’s bandwidth table puts Gen5 x8 at roughly the same theoretical one-direction bandwidth as Gen4 x16: about 31.5 GB/s before PCIe transaction overhead.
This also puts the width question from my earlier SFF post in context. The card advertises an x16 capability in its PCI registers, which monitoring reports as its maximum. Its specified interface is x8, and it has trained to x8 in both hosts: Gen4 on the 24 GB card’s former host, Gen5 on the ASUS. The new guest reports Gen5 with the same q35/OVMF arrangement. That corrects an ambiguity in the earlier post: the 24 GB card’s former physical platform imposed the Gen4 limit; virtualization itself did not. This was a separate machine from the 96 GB card’s AORUS host.
Check the link in Linux#
I identify the board on the physical host, then inspect the PCIe tree and the NVIDIA functions:
sudo dmidecode -s baseboard-manufacturer
sudo dmidecode -s baseboard-product-name
sudo dmidecode -s bios-version
lspci -Dnnk -d 10de:
lspci -t
dmidecode reads firmware-reported inventory; it does not measure a negotiated link. In the tree,
find the GPU and its upstream bridge. Replace these example addresses with the ones from your host:
GPU_BDF=0000:01:00.0
UPSTREAM_BDF=0000:00:01.0
sudo lspci -s "$GPU_BDF" -vv | grep -E 'LnkCap:|LnkSta:|Region [0-9]:'
sudo lspci -s "$UPSTREAM_BDF" -vv | grep -E 'LnkCap:|LnkSta:'
In lspci, LnkCap describes capability and LnkSta describes the negotiated state.
This is an excerpt from the ASUS upstream-port inspection, with addresses and unrelated fields omitted:
LnkCap: ... Speed 32GT/s, Width x8 ...
LnkSta: Speed 2.5GT/s ... Width x8 ...
That is a Gen5-capable x8 port running at Gen1 x8 while idle. NVIDIA explicitly documents that link generation and width may be reduced when the GPU is not in use. In the guest, where the NVIDIA driver runs, I can sample the reported state while a normal model request is active:
nvidia-smi --query-gpu=name,pcie.link.gen.current,pcie.link.gen.max,pcie.link.width.current,pcie.link.width.max --format=csv --loop=1Stop the sampler with Ctrl-C, and repeat the host-side check during the same activity. The host shows the upstream path that a VM’s virtual PCI tree cannot establish. Compare current generation, width and both ends of the link before diagnosing a downgrade from one idle reading.
What PCIe speed changes for inference#
PCIe matters when moving data between host memory and GPU memory: loading weights, offloading parts of a model, and some multi-GPU communication paths. Once the weights sit in VRAM, the GPU reads them from its own memory for every token. NVIDIA’s CUDA guidance recommends keeping reused data on the device for precisely this reason.
So I want a healthy link, but I cannot turn “Gen5” into a tokens-per-second prediction. The model, quantization, context, batching and memory use still determine what the service does. These cards support PCIe 5.0; that does not make a Gen4 host unusable.
The first startup after consolidation shows where the traffic is. Sampled PCIe receive throughput peaked at 1.76 GB/s while the model loaded. In the two busy serving hours examined afterward, the hourly maxima were about 12 MB/s into the GPU and 2 MB/s out. The exporter updates at roughly 30-second intervals, so these observations can hide short bursts. They describe this single-GPU service with resident weights; offloading or splitting a model across cards would need its own measurements.
The retained telemetry adds the before-and-after picture. Checking width and generation together in the same samples, the 96 GB card reached Gen5 x16 before the move and Gen5 x8 afterward. The 24 GB card reached Gen4 x8 before and Gen5 x8 afterward. Each available hourly window contained at least one of those faster states; neither link was stuck at its idle generation.
The loading logs offer a useful comparison. Across twelve earlier starts, weight loading took 37.18-49.65 seconds. Four starts immediately following guest boots took 42.75-49.65 seconds; the first start after the move took 43.59 seconds, with the same model and vLLM image digest. The engine reported the same 73.24 GiB GPU memory footprint after loading.
There is only one post-move start, and the guest kernel changed from 6.12.107 to 6.12.111 at that boot. Storage, cache state and deserialization also affect loading, so these records cannot isolate the effect of the narrower link.
Each bar is one restart from the retained Loki startup logs, in chronological order. An asterisk marks a start following a guest boot; cache state for the other starts is unknown. Only the orange ASUS bar belongs to the consolidated host. Twelve earlier starts and one later start are useful context, not a controlled PCIe benchmark.
The BIOS checklist needed more precise names#
The old arrival checklist grouped Above 4G Decoding and Resizable BAR into one item, with both to be enabled. That was too casual.
- Above 4G Decoding permits suitable PCI resources to be mapped above the 4 GiB address boundary.
- Resizable BAR changes the size of a CPU-visible memory aperture. It does not add PCIe lanes or VRAM.
- VT-d and the IOMMU provide the address-translation and isolation machinery used for device assignment.
ASUS exposes these as separate settings; its Re-Size BAR option depends on Above 4G Decoding. The W680-ACE series BIOS manual and the Linux VFIO documentation describe different mechanisms here. The manual predates my BIOS 4601, so it explains the settings rather than proving their effective state in this build.
On the old AORUS board, Above 4G Decoding worked with the same CPU and memory. On ASUS, I had left it at its default, and the physical host would not boot. The onboard Q-Code display helped locate the failure during startup; disabling Above 4G Decoding got the machine booting again. I did not retain a reliable record of the exact code, so I cannot turn it into a diagnosis.
My working configuration now has Above 4G Decoding disabled, yet the host inspection shows a 256 MiB BAR1 aperture on each card, with both mapped above 4 GiB. The boot journal already finds both apertures there during initial PCI enumeration. Linux later reallocates the 24 GB card’s BAR1, still above 4 GiB, while the 96 GB card keeps its original mapping.
That does not fit a simple reading of the ASUS setting’s documented purpose. The remaining question is what the switch changes in this firmware build. A saved settings capture, including the separate Re-Size BAR state, and a controlled comparison would help answer it. The BAR addresses alone do not explain the failed boot or justify a blanket recommendation to disable the setting.
My arrival checks had ticked the BIOS/BAR item because the guest could see all 97,887 MiB of GPU memory. The post-move inspection reports that same capacity with a 256 MiB BAR1. Visible VRAM was the wrong measurement for checking a BAR aperture.
The failure was at host startup, so a guest MMIO workaround would not explain it. The cause remains open; I have no basis for a general recommendation to disable Above 4G Decoding or Resizable BAR.
The revised checklist records the exact setting, firmware version, BAR sizes, and where failure occurs: host startup, VM startup, driver initialization, or model loading.
Passthrough: one owner for every device function#
The physical host owns PCI assignment. The VM owns the NVIDIA driver and container runtime. Kubernetes only sees the GPU after both layers work.
The first automated VM creation failed because the account could not assign raw PCI devices. A later timeout left a partially created VM behind. Before retrying, I had to inspect the actual guest and reconcile automation state: a timeout did not mean that nothing had been created.
My Ansible Proxmox role enables the passthrough modules, manages driver binding and rebuilds the initramfs when that configuration changes. The K3s role then checks for the expected PCI device inside the guest before trying to validate the NVIDIA stack.
The two-card move exposed a particularly unhelpful configuration trap: repeated ids= assignments
to vfio-pci do not form a combined list. The last assignment wins. Adding a second card on a
second options line could silently leave only one card selected for VFIO.
For these exact two products, the managed options line contains both GPUs and their audio functions:
options vfio-pci ids=10de:2bb4,10de:22e8,10de:2c33,10de:22e9 disable_vga=1Those IDs identify these two products; other cards need their own. The Ansible role now owns
the complete /etc/modprobe.d/vfio-pci-ansible.conf file and removes superseded options from the
older shared file. One authoritative configuration is easier to verify than several additive edits.
IOMMU groups are a separate check. A successfully running VM proves that a device was assigned; it does not, by itself, document the isolation of every function in the group. I check group membership, the driver bound to each function, and whether unrelated host devices share that group. Linux VFIO treats the group as the unit of ownership.
For the GPU address selected above, these host commands show the group members and driver binding:
ls -l /sys/bus/pci/devices/"$GPU_BDF"/iommu_group/devices/
lspci -Dnnk -d 10de:
cat /proc/cmdline
Inspect every member of the group, including the audio function. Check the kernel command line for an ACS override before describing those groups as native hardware isolation.
The post-move inspection shows both GPUs bound to VFIO, with each GPU and audio function in its own
IOMMU group. It also found pcie_acs_override=downstream,multifunction still on the host command line.
That option is absent from the current Ansible inventory, but the GRUB task adds required options
without removing pre-existing ones.
This is an unresolved configuration gap. I have not booted this build without the override, so the observed groups do not establish the board’s native isolation. Removing it and checking the result belongs in a separate host-maintenance window.
For the VM side, Proxmox recommends q35, OVMF and PCIe presentation for GPU passthrough. The guest still needs a compatible driver. Inside the VM, NVML reported the same link width and generation as the host. Only the host inspection shows the upstream port; neither reading measures throughput.
From the physical card to an inference request#
Each layer has its own evidence. Seeing the card in the guest is necessary, but there are several more steps before a client can use it:
flowchart TD
HW["Physical host
Power and cooling
BIOS and PCIe"]
HV["Proxmox and VFIO
IOMMU and binding
GPU assignment"]
VM["Guest VM: Ansible
NVIDIA driver
Container Toolkit"]
K8S["K3s: GitOps
Runtime and plugin
Workload placement"]
MODEL["Model service
Weights and engine
KV cache and readiness"]
CLIENT["Client request
Gateway alias
Usable response"]
HW --> HV --> VM --> K8S --> MODEL --> CLIENT
What actually installs the NVIDIA stack#
Ansible installs the guest’s NVIDIA driver and Container Toolkit. Argo CD deploys the NVIDIA device plugin, GPU Feature Discovery, Node Feature Discovery and DCGM exporter. I use these components separately; this cluster does not use GPU Operator to manage the stack.
| Layer | What I need to see before moving on |
|---|---|
| Proxmox and VFIO | GPU functions assigned to the intended VM, with the host’s grouping checked. |
| Guest driver | The expected GPU visible through nvidia-smi, after any required reboot. |
| K3s containerd | NVIDIA runtime usable by a workload, not merely a toolkit package installed. |
| Device plugin | The expected allocatable GPU count on the right worker. |
| Scheduling | A GPU request, RuntimeClass, node selection and taint toleration that agree. |
| Application | The exact checkpoint loads, becomes ready and answers through the normal client route. |
The 96 GB node uses the whole-card profile: one allocatable nvidia.com/gpu, rather than eight
time-sliced scheduling slots. The device-plugin configuration still contains alternative profiles;
their presence in a ConfigMap does not mean that a node selected them.
The 24 GB worker currently selects a four-slot time-slicing profile for support workloads.
Those slots share the same physical memory and do not provide four isolated 24 GB cards.
Separate VMs make that placement predictable. The deployed NVIDIA device plugin, v0.20.0,
disables custom resource names: two different cards in one worker would enter the
same nvidia.com/gpu resource pool. A request for one GPU
would not select 96 GB rather than 24 GB, and a node selector chooses the worker, not a particular
card inside it. NVIDIA documents per-node configuration and resource sharing.
Keeping one card per worker lets me select the large card’s whole-GPU profile independently
of the smaller card’s sharing profile. I have not tried passing both cards into one VM.
This is a scheduling choice, not a general claim that different NVIDIA GPUs cannot work together.
Why I kept the large card whole#
Multi-Instance GPU, or MIG, divides a supported GPU into instances with dedicated memory and compute
resources. That is different from time slicing, where workloads share the physical GPU without
equivalent memory isolation. I considered MIG and deferred it until the baseline was measured.
The Max-Q supports
24 GB and 48 GB MIG partitions, but the current model’s 73.24 GiB GPU footprint does not fit
either. Its full-card 96 GB profile would leave no partition for another service.
There is also a configuration boundary: under passthrough, my worker reports
nvidia.com/mig.capable=false. I have not tested the changes needed to expose MIG in this setup;
the card’s product support does not make MIG available in the current VM configuration.
A simplified workload fragment makes the scheduling contract visible:
spec:
  runtimeClassName: nvidia
  nodeSelector:
    workload.ai/gpu-tier: big
  tolerations:
    - key: workload.ai/dedicated
      operator: Equal
      value: gpu
      effect: NoSchedule
  containers:
    - name: inference
      # Image, checkpoint, mounts, ports and probes belong here too.
      resources:
        requests:
          nvidia.com/gpu: 1
        limits:
          nvidia.com/gpu: 1
This is the GPU part of the Deployment. The model disk, CPU and RAM budget, image, startup probe and network policy remain part of getting an engine to start.
Model weights need a disk before they need VRAM#
Before a model can load, its weights have to reach the node. The locked files for the revised candidate set totaled 282.78 GiB, against roughly 212 GiB in the original shortlist. Downloading every format in a multi-quantization repository would have required still more space; I needed the specific locked files.
I keep the weights on an additional model disk attached to the GPU VM, under /models/vllm,
and mount that directory into serving Pods through hostPath. I chose this local model store
over NFS for speed, without a controlled comparison of the two. It belongs to that worker: a prefetch Job on the other
GPU worker does not populate the same cache. Before downloading, I check the mounted filesystem
and its free space on the exact worker that will load the model.
The early download-rate estimate also needed checking. Three sequential 256 MiB range requests averaged about 10.13 MiB/s. During the actual parallel download, network telemetry recorded about 100.98 MB/s, with disk writes independently confirming the higher rate.
Both observations were useful once I stopped calling either one “the uplink speed.” At the parallel rate, the roughly 216 GiB multi-file portion would take about 38 minutes. At the single-stream rate, the 66.8 GiB GGUF pair would take roughly 1.9 hours. These are projections, not measured end-to-end download times. One connection was a poor predictor of parallel work, and parallel throughput was a poor predictor of a single large file.
The vLLM prefetch Job was OOMKilled twice while configured with a 4 GiB memory limit. I raised its limit to 16 GiB. Disk fit, network throughput and downloader memory were three separate budgets.
If you restrict model-download egress, test the artifact’s redirects as well as the repository URL.
My Hugging Face download reached us.aws.cdn.hf.co. With Cilium 1.19.6, *.hf.co would not match it:
the single wildcard does not cross dots. My vLLM prefetch allowlist uses
huggingface.co, hf.co, **.huggingface.co and **.hf.co on TCP 443, plus DNS.
That is my configured allowlist, not a complete list of requirements for every Hugging Face download.
Also test a destination that must be denied; an overlapping broad allow policy can defeat the restriction.
Four defects the checks missed#
Rendering, schema validation, a server-side dry run and the repository tests passed. There were still four defect classes across two staged model deployments:
| Candidate | Failure | Where it became clear |
|---|---|---|
| GLM | A configured tool parser did not exist in the serving engine. | Engine startup. |
| Gemma | The memory budget left too little KV cache. | Startup validation, before a long request could run. |
| Gemma | The tool parser did not match the model’s emitted syntax. | A real tool-call check. |
| Both | The rendered workloads requested no GPU. | Inspection of the rendered manifests. |
A Pod without a GPU request is valid Kubernetes. A parser name in an application argument is valid YAML. The missing piece was checking the behavior I actually wanted, with the exact image, checkpoint and configuration together.
The comparison also needed deliberate replica ownership. Manually scaling a parked candidate up fought Argo CD’s desired count of zero, and the controller scaled it back down. For the comparison, replica management had to be explicitly delegated; for production, the desired running state had to be committed.
I had to repair the measurements before trusting the comparison#
One power-violation query reported a physically impossible 454% of wall time. Checking it again while writing this post exposed a unit error: the DCGM field is in nanoseconds, but the query divided by a microsecond-sized window. With the recorded numerator and the correct 10-minute denominator, the arithmetic gives 0.454%. This is a correction of the old query, not a fresh measurement.
There was a separate identity problem. DCGM exporter attached workload labels when a Pod claimed the card and removed them when it left. Loading and unloading candidates therefore split one device’s history across series. I dropped those labels at scrape time and turned off the exporter’s pod-label option. That repair did not correct the unit error; the related alert formulas still need a separate review.
The dashboard also needed to distinguish the two cards. A fleet total can hide a missing target, and a blank error counter is not evidence of an error-free card. I want a positive scrape and temperature signal first, followed by per-card utilization, framebuffer use, power, temperature, slowdown information and PCIe link state.
An 85 C cutoff was my rule, not the card’s verdict#
The initial comparison used six configurations, including two quantizations of the same smaller Qwen model. Under the then-current stop rule, the dense Gemma and T-pro runs were stopped with sampled peaks of 86 C and 87 C. The recorded thermal-violation counter remained zero. The accepted 122B candidate had peaked at 84 C in that comparison, and staying below my cutoff had helped its selection.
I initially gave that too much meaning. The follow-up audit found 37 one-minute buckets at or above 85 C across 2.6 days, spread across 14 hours of the card’s history, including the comparison runs, with no recorded thermal violations. Those are sampled buckets, not 37 continuously observed minutes or a measurement of the accepted model alone. I had not established a defensible reason for using that temperature as a selection boundary.
I withdrew that experimental cutoff. This did not remove monitoring or make heat irrelevant. It left the replacement acceptance threshold unresolved. The small comparison also confounded model architecture with power draw, so it did not establish that dense models were inherently unsustainable. These measurements also predate the new enclosure.
There was a similar correction in the kernel investigation. One NVFP4 checkpoint selected a weight-only fallback; another selected a native path on the same card. That was a difference in checkpoint and serving-path support, not proof that the GPU lacked native low-precision capability. I now record the selected kernel with the exact checkpoint instead of generalizing from the first log.
What the model speed numbers actually measured#
The preserved harness repeated one Russian explanation prompt through LiteLLM, at temperature zero, with a 1,024-token output limit. Its throughput was reported completion tokens divided by the entire streaming request duration, including time before the first token. It was not isolated decode throughput or a concurrency test.
| Test configuration | Engine / selected path | Requests | Mean request throughput, tokens/s |
|---|---|---|---|
| Qwen3.6-35B-A3B, NVFP4 | vLLM / Marlin | 5 | 254.19 |
| Qwen3.6-35B-A3B, Q8_0 | llama.cpp | 5 | 200.00 |
| T-pro-it-2.1, Q8_0 | llama.cpp | 5 | 37.48 |
| GLM-4.7-Flash, BF16 | vLLM | 5 | 114.36 |
| Gemma-4-31B-it, BF16 | vLLM | 3 | 21.46 |
| Qwen3.5-122B-A10B, NVFP4 | vLLM / FlashInfer CUTLASS | 5 | 84.13 |
These are small, sequential smoke measurements on the 96 GB card’s AORUS host. The accompanying correctness checks were also narrow: a few prompts, not a comprehensive quality or safety evaluation. They do not establish that the fastest entry was the best model, or predict the current service’s sustained capacity. I keep the numbers because they explain the experiment, with the input and timing definition needed to read them honestly.
Promotion includes the things around the model#
The comparison ended with nvidia/Qwen3.5-122B-A10B-NVFP4 promoted to serve seven
chat and agent aliases. Embedding, reranking, speech and rollback routes remained separate.
I chose it over the faster 35B model for a combination of a native FP4 serving path, limited Russian-output checks and throughput close to the previous service. The 22-prompt language check counted Cyrillic output and English leakage; the planned manual quality scoring was never completed. That was enough for my provisional choice, with the thermal caveat above, but it leaves a proper quality comparison on the backlog.
The selected service needed more than a successful benchmark. Stopping the previous service while Git still declared it active left monitoring expecting an endpoint that I had deliberately removed. An always-on engine’s preallocated framebuffer pool also sat just above a global occupancy alert threshold. Reducing its configured memory fraction from 0.90 to 0.88 restarted the engine and interrupted requests for about two minutes. Alert tuning had become a serving change.
Autoscaling added another boundary. When I unpaused a candidate after its benchmark, KEDA still
saw traffic in the trigger’s increase(vllm:request_success_total[15m]) and kept it resident,
blocking the next GPU workload. Separately, the promoted service inherited the canary’s
minReplicaCount: 0 and 900-second cooldown, which could shut down the main service after idle
time. Both the trigger’s history and the scale-to-zero policy needed review before promotion.
I now review routing, probes, replica ownership, autoscaling and alerts together when promoting a model. A green Argo application is one observation. The useful finish line is a ready workload, a ready Service endpoint, and a request through the alias the client actually uses.
After consolidation, both guests ran Debian 13, K3s v1.36.2 and NVIDIA driver 615.71.09.
The main service was Qwen3.5-122B-A10B-NVFP4 on vLLM v0.28.0. I traced the normal code alias
through LiteLLM and a ready Service endpoint to the Pod requesting the 96 GB GPU.
Maintenance is part of onboarding#
Driver and toolkit packages are managed through Ansible; Kubernetes components and serving images live in GitOps. A routine package upgrade exposed a gap between those layers. It installed NVIDIA userspace 615.71.09 while kernel module 610.57.04 stayed loaded. New GPU containers failed with an NVML driver/library mismatch. The running 96 GB service survived because its container predated the upgrade, and DCGM remained green with its earlier NVML handle.
The general update role watched /var/run/reboot-required, which this Debian DKMS rebuild did
not create. The driver-install role has its own reboot handling, but routine package upgrades
took the other path. I still need a guard that compares the loaded NVIDIA module with the installed
driver packages and exercises a fresh GPU container after an upgrade.
The post-move inspection found both guests on 615.71.09 with working GPU containers; the historical
mismatch is gone, while the upgrade path still needs that guard.
Serving-image updates have their own ordering constraints. For the move from vLLM
0.26.0 to 0.28.0, I updated the gateway first to handle the engine-output rename from
reasoning_content to reasoning, then deployed the release image pinned by digest. The previous
image identity stayed recorded as the rollback source.
The consolidation also left configuration work open. The VM definitions in Terraform still
describe the former two-host placement. Both live GPU VMs have onboot: 0, so starting the host
does not start those guests automatically. Bringing them up remains an explicit step.
For an update, I keep the previous package or image identity, change one layer at a time, and
repeat the short chain: device visible, runtime usable, GPU allocatable, engine ready, client
request succeeds, telemetry present. A reported CUDA compatibility version from nvidia-smi
does not establish which CUDA runtime an engine image actually contains.
The host move adds a new configuration to verify; it does not turn the earlier benchmark into a result for this motherboard and cooling setup.
What the new enclosure has shown so far#
The current monitoring is useful as a baseline, even before a controlled cooling test. This chart uses the DCGM power and temperature series behind my Grafana dashboards. It spans the move from the AORUS host to the consolidated build. I kept the gap instead of joining the line across missing observations.
Hourly means, UTC; each timestamp marks the end of the averaged hour. For each series, 323 of 360 hourly points are available; missing points remain gaps. The long gap coincides with the move, but includes a monitoring outage, so it cannot time GPU downtime precisely. Hourly averages also hide short temperature and power peaks.
At finer resolution, the retained one-minute points at 295 W or more averaged 81.8 C before the move and 81.2 C afterward: 788 points before, 140 after. Fan readings averaged about 58% and 56%, respectively. Those are similar observed temperatures near the card’s 300 W limit.
The retained thermal-violation series showed no increase, including during busy periods, but it has gaps and no captured positive event to validate that signal. Room temperature was not measured, and I have no host sensor series for the CPU, board or drives in the new enclosure. This gives me a baseline for tuning; it does not yet isolate a cooling improvement from the case.
How the build changed#
- Arrival: the 96 GB card joined a separate host. The plan moved from several resident services to one whole-card engine.
- Initial comparisons: the 96 GB card ran on the AORUS host at up to Gen5 x16. The model comparisons belong to that configuration; the 24 GB card remained on its own Gen4 x8 host.
- Consolidation: the ASUS board, Chieftec case and two GPU worker VMs brought both cards onto one physical host at Gen5 x8/x8. The Above 4G boot failure still needs reconciliation with the BAR evidence.
- Post-move checks: weight loading took 43.59 seconds, within the earlier 37.18-49.65-second range. Near 300 W, sampled temperatures were similar. Neither comparison isolates the motherboard or enclosure’s effect, and the earlier model-speed results need a repeat on this build.
Before tuning inference further, I need to reconcile configuration drift, upgrade handling and alert formulas. Open platform checks include the firmware state behind the boot failure, host-memory headroom, transfer capacity under load, native IOMMU grouping without the inherited ACS override, and controlled cooling measurements.
Complete GPU onboarding checklist#
For a similar GPU build, work through these layers in order. Each step should end with an observation you can repeat, from powering on the host to answering a request after maintenance.
- Identify the exact card and platform. Record the GPU edition, power budget, slot wiring, enclosure and cooling. Follow the GPU manufacturer’s power-connection instructions; for this Max-Q, NVIDIA specifies its included adapter with two separate PCIe 8-pin PSU cables. Check any motherboard slot-power input. Include the NIC and read the board’s dual-card slot table.
- Check firmware and the physical link. Record the BIOS version and the VT-d, Above 4G and ReBAR states separately, along with the assigned BAR sizes. Locate failures at the host, VM, driver or engine layer. Compare capabilities with negotiated speed and width under load, including the upstream port.
- Prove the assignment boundary. Inspect IOMMU groups and all device functions; verify host binding and guest assignment. Check for ACS overrides before claiming native isolation. Keep one authoritative VFIO configuration and decide which GPU belongs to each VM.
- Bring up the guest runtime. Compare loaded-module and installed-driver versions, validate the GPU after reboot, and exercise a fresh workload through the NVIDIA container runtime.
- Verify scheduling. Check the selected device-plugin profile, allocatable count and rendered GPU request. Confirm that node labels, taints and RuntimeClass select the intended worker. Choose whole-card, time-sliced or MIG allocation deliberately, verifying support in the actual guest configuration. Advertised slots are not extra VRAM.
- Fetch one exact checkpoint. Measure disk fit, downloader memory and the real transfer path. Choose and mount the model disk, leave working space and avoid unused quantizations. If egress is restricted, test both allowed and denied destinations.
- Start the engine early. Use the intended image and checkpoint. Check KV-cache capacity, selected kernels, readiness and one representative tool call before a long comparison.
- Qualify the telemetry. Verify scrape coverage, per-card identity, units and missing-series behavior. Investigate impossible percentages before using the graph to choose a model.
- Promote the whole service. Move aliases, probes, replica policy and alerts together. Exercise the client-facing route, then repeat it after the planned restart or maintenance event. Check VM autostart policy, fresh-container driver compatibility and the rollback source.
- Keep the comparison reproducible. Save the input, engine and checkpoint identities, sample count, timing definition, power conditions and topology. Re-measure after hardware changes.