
Noise is a reliability problem you can feel.
I wanted nodes that can run 24/7 near living space without the small-jet-engine soundtrack, while still behaving like proper homelab citizens: predictable thermals, real storage, and real networking. Not one hero server. Four small, identical, silent bricks.
This is a review after two years of 24/7 operation: what it is, how I got here, what broke, what I measured, and what I would do again.
The numbers up front:
| At a glance | |
|---|---|
| Fans in the case | 0 |
| Identical nodes | 4 |
| PL1 CPU power cap | 35 W |
| RAM per node | 96 GB |
| 10G TCP goodput, measured | 9.27 Gbit/s at MTU 1500 |
| Thunderbolt full duplex | 7.23 + 7.09 Gbit/s, 14.3 aggregate |
| Platform power, RAPL PSys spot reading | ~51 W |
| Oldest drive (reused from the old box) | ~25,000 power-on hours |
From one old Ryzen box to four identical bricks#
Before this setup the lab ran on a single aging Ryzen desktop with Proxmox and not enough RAM. Nothing was on fire. I gave the machine away anyway, because I wanted something more reliable, more expandable, and honestly, because a homelab is mostly a license to experiment. I had always been drawn to silent machines: years ago I saw a fully passive case with a solid copper lid and never quite recovered from it.
So the replacement was not a bigger server. It was four identical mini-PCs, bought over a few weeks in spring 2024, configured the same way, running 24/7 with zero fans in the case. The wider cluster grew up gradually around them, and they became its compute backbone: Proxmox on every node, Kubernetes inside VMs, and a spare node that sits half-empty as recovery headroom.
The receipts, because a hardware post without prices is just marketing: the April 2024 order came to about 4,100 zl for two Akasa cases and the first barebone, and May 2024 added two 8 TB QVOs for roughly 3,800 zl. The rest of the fleet followed the same pattern.
The build#
| Component | Part | Notes |
|---|---|---|
| Barebone | ASUS ExpertCenter PN64-E1 | designed for 24/7 duty; fits Akasa’s custom passive case |
| Case | Akasa Turing Duo Pro | the whole chassis is the heatsink |
| CPU | Intel Core i7-13700H, 14C/20T | capped on purpose, see the power contract below |
| RAM | 2x Crucial 48 GB DDR5-5600 SODIMM | 96 GB at 5200 MT/s; ASUS lists 2x32 max - solid anyway |
| System disk | Samsung 970 EVO Plus 1TB NVMe | ESP + LVM root |
| Data disk | Crucial T700 4TB Gen5 NVMe | 4Kn, LUKS -> ext4; runs at PCIe 4.0 here |
| Bulk disk | Samsung 870 QVO 8TB SATA | cheap quiet terabytes |
| NIC | onboard Intel I226-V, 2.5GbE-capable | used at 1GbE for the management lane |
| 10G lane | Sonnet Solo 10G SFP+ TB3, Aquantia AQC100S | over Thunderbolt, MikroTik DAC into a CRS317-1G-16S+ |
Three things make these nodes what they are: built for 24/7, fanless, and with a real 10G uplink despite having no PCIe slot.
Why four small machines instead of one big server#
A good friend of mine, also a homelabber, loves the opposite approach: big chassis, big sockets, big numbers. I respect it. I run the microservices version of hardware instead, and after two years I am convinced it is the right shape for my lab.
The four boxes are genuinely independent. Three carry the compute; the fourth can idle half-empty or even powered off, existing mostly as a manual recovery and rebuild target (there is no live migration or HA here, and that is deliberate). These four are members of a larger seven-node Proxmox cluster, so losing any one of them, spare included, does not threaten cluster quorum. It still means evacuating workloads manually, because nothing moves VMs for me by design. A big server can be taken down by one bad workload; here the hardware blast radius is a quarter of this fleet at worst.
And a modern mini-PC is not actually small where it counts: 96 GB of RAM and 20 threads per node is a lot of Kubernetes.
Why fanless, and why Akasa#
A fanless case is not “a quieter PC”. It is a different contract:
- There is no fan curve to hide mistakes.
- You cannot brute-force thermals with RPM.
- The environment (clearance, orientation, ambient temperature) becomes part of the system.
Akasa-style passive cases work because the whole chassis becomes the heatsink. On the Turing Duo Pro the CPU heat moves into the case via a transfer block and heatpipes, and the fin stack does the rest. The result feels more like an appliance than a PC: heavy, solid, silently soaking short bursts. The concept was recommended to me by a friend, and moving a board into the case is genuinely a 15-minute job. My only hiccup was the shop sending a case revision for the wrong PN generation; the Polish store swapped it without drama.
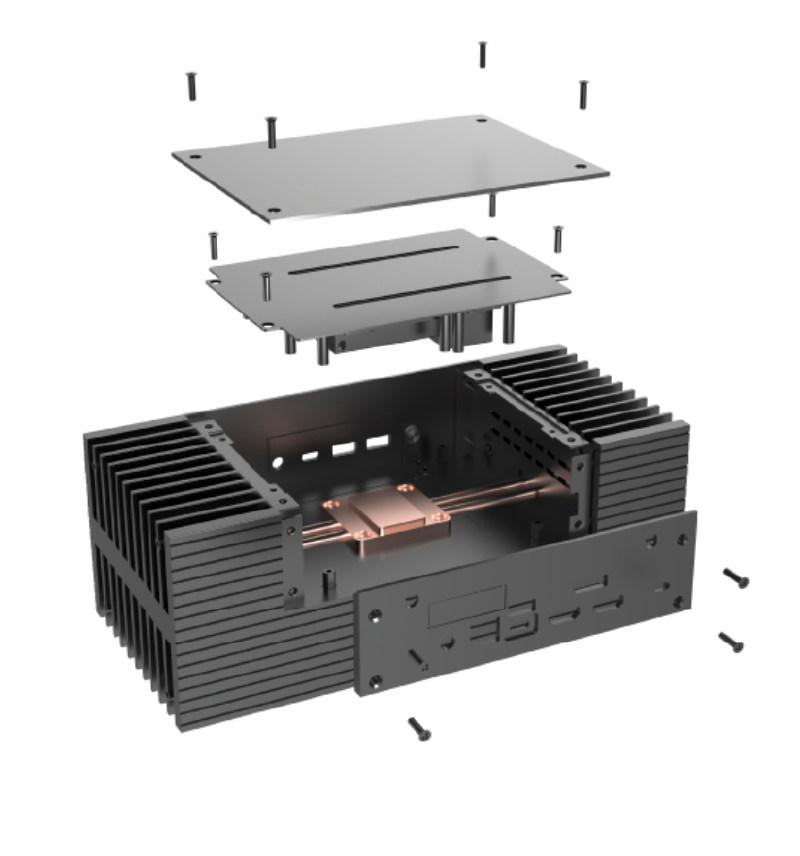
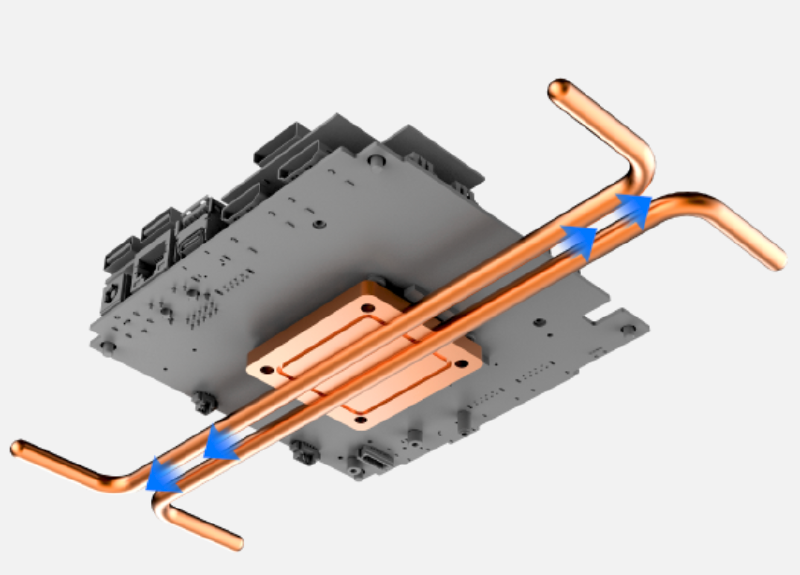
If you want to see how the thermal stack is assembled, this video is a good visual reference:
The thermal pad saga#
The build lives or dies by thermal contact, and this is where it bit me.
The case wants pads of a specific thickness for the transfer block and the M.2 area, and sourcing exactly the right ones turned out to be surprisingly hard. In my early attempts the NVMe controllers climbed to 80 C, became unresponsive under thermal stress, and disappeared from the bus. When NVMe goes, it goes hard: the device just vanishes mid-write. For a while I could not even tell what was failing.
Two things fixed it:
- Laird Tputty 607 dispensable thermal gap filler (6.4 W/mK). The stuff datacenters use instead of guessing pad thicknesses: applied from the tube as a variable-thickness layer rather than a stack of fixed pads. The layer I ended up with might be on the thick side, and the fix held for most of the fleet; current telemetry has just flagged one exception, more on that at the end of this post.
- Airflow around the cases. Physics does not negotiate: even a passive case needs the warm air to leave. The nodes sit on a rack shelf with holes drilled through it and large slow fans blowing across the fins. So the setup is not a zero-fan room, it is zero-fan cases with quiet bulk airflow around them, in a separate room on an open rack. The next iteration is a 3D-printed duct coupling a 120/140 mm fan to the fin stack, turbine style: large airflow, no whine.
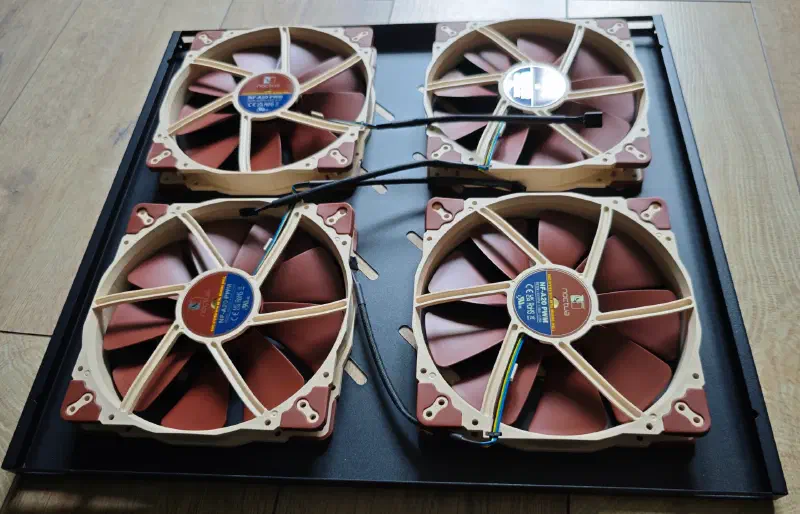
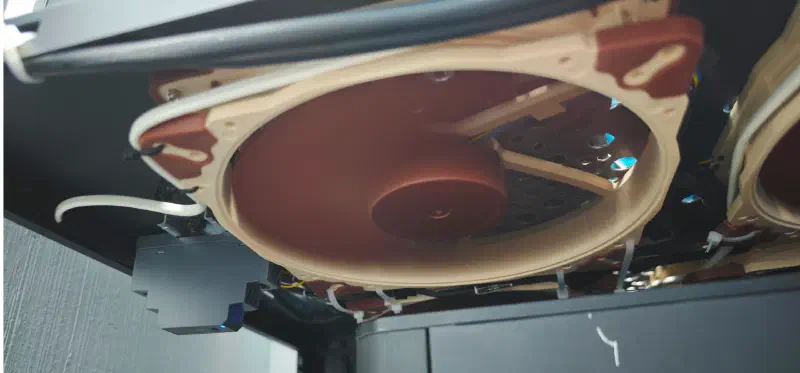
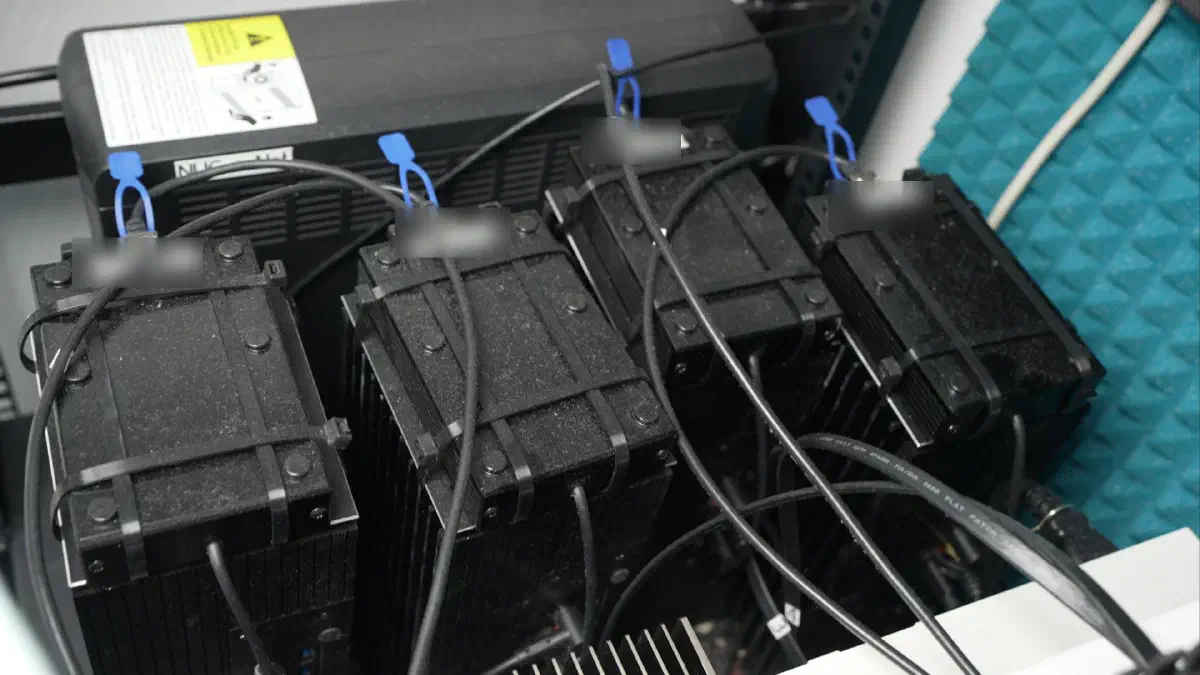
Let me be explicit about what “fanless” means here, because the photos above show four very real fans. A purely passive build did not work: the NVMe dropouts earlier in this section are what it looks like when you try. The cases are fanless and the 35 W CPU genuinely lives on chassis convection alone, but the bulk airflow across the shelf is mandatory for the drives, not decorative. Acoustically it is still the win the title promises: 200 mm fans spinning slowly move a lot of air with a soft whoosh that does not survive a closed door, and the rack gear around them, the UPS and the switches, makes more noise than the fans do. That is why the rack lives in a separate room. The living space gets the 0 RPM experience; the shelf does not, and pretending otherwise would be writing marketing instead of a review.
There is also a kernel-level scar from that era: NVMe power-state transitions were implicated in the dropouts, so APST is disabled
outright with nvme_core.default_ps_max_latency_us=0, and it has not eaten a drive since. The two flags next to it are unrelated to
the saga: iommu=pt is the passthrough plumbing, and kvm.ignore_msrs=1 is a separate KVM guest-compatibility workaround,
unrelated to the NVMe issue.
kvm.ignore_msrs=1 nvme_core.default_ps_max_latency_us=0 iommu=ptBoring and explicit, the way kernel command lines should be.
The power contract: 35 watts, decided in firmware#
“Fanless i7-13700H” only works if you decide what the CPU is allowed to burn. Intel’s official numbers for this part are 45 W Processor Base Power and 115 W Maximum Turbo Power. In this case, in this chassis, mine runs with RAPL limits set in the BIOS:
- PL1 (my sustained cap): 35 W, matching Intel’s listed 35 W Minimum Assured Power for this part
- PL2 (burst): 82 W
Turbo stays on and the governor stays on performance; the power cap, not a frequency cap, is what shapes behavior. In normal operation
(this node carries five VMs) the package draws around 20 W. Under a deliberate 10-minute torture test
(stress-ng --cpu 20 --vm 2 --vm-bytes 4G), run on a live homelab node without stopping its normal workloads:
| Metric | Normal load | Under stress (10 min) |
|---|---|---|
| CPU package temperature | 46 C | 56-59 C |
| CPU package power | ~20 W | 35.3 W, pinned at PL1 |
| All-core frequency | ~2.2 GHz | 2.55-2.66 GHz |
| NVMe composite | 54 C | 56 C |
| SFP+ NIC (MAC) | 61 C | 61.5 C |
| SATA SSD | 50 C | 50 C |
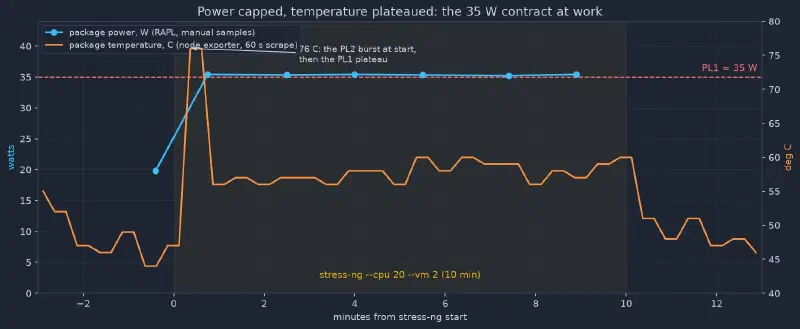
The number I care most about: zero new thermal-throttle events through the whole run (the kernel thermal_throttle counters did
not move), and the package plateaued at 59 C against a 100 C limit. The CPU was of course limited the entire time, but by power, not
by temperature: pinned at the PL1 I chose, which is the contract doing its job. Two minutes after the test it was back at 48 C.
Under this workload, the power policy was the active limit, not the case. That is exactly how I want a
fanless system to fail: against a number I chose, not against physics. For the record, the instruments: package power is the RAPL
energy-counter delta divided by the sampling interval (an on-platform estimate, not a wall meter), temperatures come from sensors,
throttle state from /sys/devices/system/cpu/*/thermal_throttle/. The temperature series in the chart, sampled more often than my
90-second manual RAPL readings, caught a brief 76 C spike right at the start; the manual power samples missed the corresponding PL2
burst before RAPL reeled everything back down to the plateau.
The thermal-throttle counters are not silent in ordinary life either: this node logged a few dozen package events over the current uptime, PL2 bursts brushing the threshold, and the counters reset at every reboot anyway. What five days of real workload does to them fleet-wide is in the table at the end of this post.
And since the title says power node, the from-the-wall reality: the RAPL PSys domain estimates about 51 W at platform level under normal production load, power-supply losses excluded. The UPS in front of this shelf read roughly 270 W at the same moment for everything it feeds: all four nodes, the four external fans, and the network equipment. Both are spot readings taken while writing this post, not long-term averages; a proper per-node plug-meter measurement is on the follow-up list.
I thought I wanted optics. I needed SFP+#
The 10G story started with copper. The first iteration used 10GBASE-T, and when I moved it into the big switch, the RJ45 SFP+ module climbed to about 98 C and kicked the switch fans into turbo. In a build whose entire point is silence, that was disqualifying.
I “switched to optics”, or so I told myself ever since. While writing this post I actually looked at what the switch reports on that port:
sfp-connector-type: copper-pigtail
sfp-vendor-part-number: XS+DA0001
rate: 10Gbps, full-duplex, auto-negotiation: done
That is not an optical transceiver. It is a MikroTik DAC: a twinax copper cable with SFP+ ends permanently attached, one meter long.
There is no fiber anywhere in this network. SFP+ is a socket, not a medium, and the atlantic driver reporting Port: FIBRE for any
SFP+ mode kept my illusion alive.
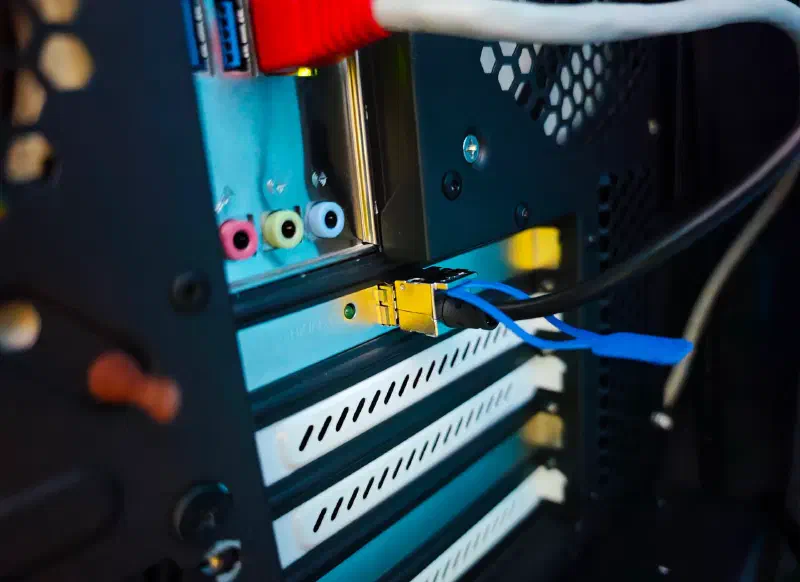
Here is the thing though: for short in-rack runs the DAC is not a compromise, it is the better pick. A passive DAC draws essentially zero power and adds no heat, an optical transceiver burns about a watt per end and ages, and the 10GBASE-T module that started this journey burns several watts and doubles as a soldering iron. Everything I wanted from “optics” (cool, stable, nothing to wear out) I actually got from a copper cable with delusions of grandeur. Fiber earns its place at tens of meters and beyond; my runs are one meter.
Thunderbolt as a PCIe slot#
These mini-PCs have no PCIe slot, but they have Thunderbolt with 40 Gb/s behind it. So the 10G NIC lives outside the case:
flowchart LR
subgraph NUC["one fanless node"]
E0["Intel I226-V
onboard 1G"]
TB["Thunderbolt / USB4 port"]
end
TB --> SON["Sonnet Solo 10G
TB3-to-SFP+ adapter"]
SON -->|"MikroTik DAC, 1 m"| SW["MikroTik CRS317-1G-16S+
16x SFP+"]
E0 --> MGMT["1G switch
management lane"]
This is what that chain looks like in the flesh, dust included:
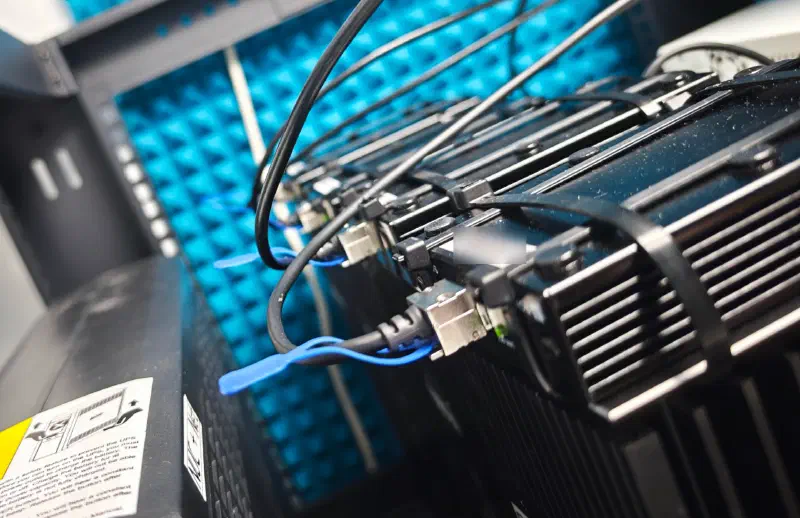
The Sonnet adapter carries an Aquantia AQC100S and is itself passively cooled, which fits the build philosophy nicely. boltctl shows
the chain running at the full 2x20 Gb/s, with the device authorized under bolt’s iommu policy - that is Thunderbolt DMA
protection, a separate knob from the kernel’s iommu=pt earlier:
* Sonnet Solo 10G SFP+ Thunderbolt 3 Edition
  type: peripheral
  generation: Thunderbolt 3
  status: authorized
  rx speed: 40 Gb/s = 2 lanes * 20 Gb/s
  tx speed: 40 Gb/s = 2 lanes * 20 Gb/s
  policy: iommu
Operationally the whole Thunderbolt story reduced to two boring pieces of configuration: the bolt daemon with the device enrolled
once, and a udev rule that re-attaches the NIC to its bridge whenever the adapter (re)appears, so a power blip or a physically
reattached Thunderbolt adapter heals itself without me. Interface naming is pinned to classic ethX via the kernel command line so the rule always matches.
During the current five-day uptime the kernel log shows one link-up at boot and then silence. That is consistent with the longer
operational history of this lane, although the current log itself only covers this boot.
The onboard I226-V stays as the second lane: cluster management traffic on 1G, completely independent from the 10G data path. Kubernetes never touches it.
The 10G numbers, measured on the live setup#
Everything below was measured on the live homelab setup: both nodes were carrying their normal Proxmox and Kubernetes load at the time, one of them running five VMs at a load average around 2. I did not quiesce anything on purpose. A lab-clean benchmark tells you what the link can do once; a test on the live system tells you how it behaves under its real workload.
Tooling is deliberately boring: iperf3 from the Debian repos (3.18 on Proxmox VE 9), one node as server, one as client:
# server (node A), bound to the 10G address on purpose
iperf3 -s -B <node-a-10g-ip>

# client (node B): four runs, each answers a different question
iperf3 -c <node-a-10g-ip> -t 30 -O 3           # 1: a single TCP stream
iperf3 -c <node-a-10g-ip> -t 30 -O 3 -P 4      # 2: aggregate ceiling
iperf3 -c <node-a-10g-ip> -t 30 -O 3 -P 4 -R   # 3: reverse direction
iperf3 -c <node-a-10g-ip> -t 30 -O 3 --bidir   # 4: both directions at once
Why exactly this shape and not another:
- Bind to the 10G addresses. These nodes also have a 1G management interface. If you let the tools pick a route, you can
spend an evening benchmarking the wrong NIC.
-Bon the server plus the 10G address on the client removes the ambiguity. -t 30 -O 3. Thirty seconds is long enough to catch drift; the first three seconds are omitted so TCP slow-start does not pollute the average.- One stream first. A single TCP connection is what a real file copy gets, and it is usually core-bound below line rate. Reporting only the multi-stream number would be marketing.
- Four streams. The aggregate ceiling of the link.
- Reverse (
-R). NIC, driver, and IRQ behavior are not symmetric. Testing one direction and assuming the other is a classic way to miss a problem. --bidir. For this build it answers the one question everyone asks: does the Thunderbolt chain choke when both 10G directions run at once?- Watch
Retr, not just the bitrate. Retransmits on a clean link should be around zero; they tell you about path quality long before throughput drops. - MTU is 1500. No jumbo frames on this network, so the honest TCP goodput ceiling is about 9.4 Gbit/s, and every result below is judged against that, not against the “10G” printed on the box.
- A second terminal runs
watch sensors. On a passively cooled node a network stress test is also a thermal test: the SFP+ cage and the NIC are part of the thermal budget.
The results, on the live setup:
| Run | Result | Retransmits |
|---|---|---|
| 1 stream | 7.72 Gbit/s | 0 |
| 4 streams | 9.27 Gbit/s | 0 |
| 4 streams, reverse | 9.26 Gbit/s | 1384 |
| bidir, both directions at once | 7.23 + 7.09 = 14.3 Gbit/s | 0 |
Reading it:
- 9.27 Gbit/s of TCP goodput with zero retransmits is close to the practical ceiling for a 10G link at standard MTU (iperf3 measures application throughput, not wire rate). The SFP+-over-Thunderbolt path needed no throughput tuning in this test.
- A single stream lands at 7.7 Gbit/s. That is normal single-flow behavior, not a defect of the adapter.
- The reverse direction shows 1,384 retransmitted TCP segments over a 32 GB transfer, at identical throughput. That is what “tested on a busy live node” looks like; TCP absorbs it silently, and I prefer publishing this number over a sterile one.
- The bidir run is the number I actually built this for: 7.23 plus 7.09 Gbit/s simultaneously through one Thunderbolt 3 link. The 40 Gb/s chain was not the bottleneck at the measured 14.3 Gbit/s aggregate load (the usable PCIe tunnel of TB3 is roughly 22 Gb/s, still comfortably above it).
- Thermals during the duplex run: SFP+ NIC at 63 C (from roughly 57-60 idle), CPU package at 64 C, NVMe under 60 C. No throttling, comfortable margins, still zero fans in the case.
Storage: three tiers in a shoebox#
This node is storage-heavy for a mini-PC because it is meant to do work, not just host dashboards:
NAME      MODEL                         SIZE  ROLE
nvme_a    Samsung 970 EVO Plus 1TB    931.5G  system: ESP + LVM root
nvme_b    Crucial T700 4TB (Gen5)       3.6T  data: LUKS -> ext4
sda       Samsung 870 QVO 8TB           7.3T  bulk SATA
Three details worth calling out:
- The Gen5 drive runs at Gen4. The T700 is a PCIe 5.0 SSD, but this platform’s M.2 lanes are PCIe 4.0:
lspcireportsLnkCap: 32GT/sagainstLnkSta: 16GT/s (downgraded), x4. I bought it for the 4Kn path and the price per terabyte, not for Gen5 sequential bragging rights, so nothing of value was lost. - The Gen5 drive is formatted 4Kn (4096-byte LBA:
lsblkreportsLOG-SEC/PHY-SEC4096 both for the device and for the dm-crypt mapper above it, so the 4Kn geometry survives the whole stack, not just 4K filesystem blocks), while the system drive is classic 512B. That is intentional: I wanted to run the 4Kn path end to end instead of discovering its quirks by accident later. - NVMe enumeration is not stable across boots. Which drive is
nvme0n1and which isnvme1n1has flipped on this node between kernels. Everything that matters references filesystems by UUID, and so should you.
The SMART counters double as this post’s receipts for the “24/7, 2 years” claim. The SATA drive was reused from the previous Ryzen box and now shows about 25,000 power-on hours; the drives bought with the nodes agree with the timeline: the Gen5 drive about 19,700 hours with 76 TB of host writes and a Percentage Used of 8% in NVMe SMART, the system drive about 14,800 hours at 2%. The fleet has been awake this whole time, and after the pad saga was fixed, none of the drives have logged a single media error.
So what about speed?#
Writing this post I went back and counted how many different speeds are printed on this one 10G lane. Six, and only one of them is the speed I actually get. That gap is worth a section of its own, because every number in it is true and almost none of them are the answer.
| Hop | Ceiling | Where the number comes from |
|---|---|---|
| TCP goodput at MTU 1500 | 9.41 Gbit/s | frame arithmetic; measured 9.27, so 98.5% of it |
| SFP+ cage, both ends | 10.0 Gbit/s | the binding constraint of the whole chain |
| The DAC cable | 25 Gbit/s | MikroTik rates XS+DA0001 at 1G / 10G / 25G |
| NIC PCIe attachment | 31.5 Gbit/s | lspci: PCIe 3.0 x4, native for the AQC100S |
| Thunderbolt 3 PCIe tunnel | ~22 Gbit/s | Intel’s TB3 brief, “data only” profile |
| Thunderbolt link | 40 Gbit/s each way | boltctl: 2 lanes x 20 Gb/s, per direction |
| Switch fabric | 322 Gbit/s | MikroTik’s RFC2544 table for the CRS317 |
Read it bottom to top and the shape of the thing appears: everything around the endpoint is faster than the endpoint. The cable has 2.5x the headroom it is allowed to use, the Thunderbolt tunnel roughly 2x, the switch fabric thirty times over. The 10 Gbit/s SFP+ cage is the narrowest ring in the chain, and it is the one part I cannot upgrade without replacing both ends of the link.
Three readings on this path are actively misleading, and I fell for two of them.
lspci lies about Thunderbolt, by specification. The Thunderbolt root port reports LnkCap: Speed 2.5GT/s, Width x4. Taken at
face value that is PCIe 1.0 x4, about 1 GB/s, which is less than the throughput I measure through it. It is not a downgrade and not
a defect: the USB4 spec requires ports used for tunneling to advertise 2.5 GT/s and states outright that the value does not represent
actual throughput. The real PCIe link is one level down the tree, on the adapter’s own bridge, and only boltctl will tell you what
the tunnel itself is worth. Any capacity planning done from lspci on a Thunderbolt device is planning against a placeholder.
My “10G cable” is a 25G cable. In MikroTik’s naming the suffix is the speed class: S+ is SFP+ at 10G, XS+ is SFP28 at 25G,
Q+ is QSFP+ at 40G. I own XS+DA0001, so the copper between the node and the switch is a 25 Gbit/s part, quietly running at 10
because both cages it plugs into are SFP+. I did not buy it for headroom, I bought it because it was the one-meter DAC in the box,
and I only learned what I owned while fact-checking this article.
ethtool describes this fibre port in copper terms. It prints Supported link modes: 100baseT/Full for a link running 10 Gbit/s
over an SFP+ cage. That one is cosmetic, the atlantic driver labels its modes with baseT names regardless of medium, but combined
with the Port: FIBRE line I quoted earlier it is a small monument to how little the kernel’s idea of this NIC resembles the hardware.
The storage side has the same shape, mirrored. The T700 is a PCIe 5.0 drive rated at 12,400 MB/s that runs at Gen4 x4, so its practical ceiling is the link’s 7,877 MB/s rather than the sticker. I assumed the board was cheaping out. It is not: on Raptor Lake-P the CPU exposes one x8 port that can do Gen5 and two x4 ports that top out at Gen4, so a Gen5 x4 M.2 slot is not something this silicon can offer at all. Nobody made a mistake here except me, when I read the number on the box.
Put every tier in the same unit and the ranking is not the one I expected:
| Path | Real throughput |
|---|---|
| Crucial T700, as installed | ~7,000 MB/s |
| Samsung 970 EVO Plus | 3,500 MB/s |
| 10G lane, measured | 1,159 MB/s |
| Samsung 870 QVO, burst | 560 MB/s |
| Samsung 870 QVO, sustained write | 160 MB/s |
| Onboard 1G management lane | 125 MB/s |
The bulk SATA drive, once its SLC cache is full, writes at about a seventh of what the network can deliver. For the workload these nodes actually do, the 10G lane has never once been the constraint. I built the fast pipe and then filled the slow end of it with QLC, which is a very homelab thing to do.
One free improvement is sitting there untaken: at MTU 9000 the goodput ceiling rises from 9.41 to 9.90 Gbit/s, about 5% for the cost of a config change. I have not done it because the MTU has to match end to end across every VLAN and guest on this network, and a 5% gain is not worth a fleet-wide MTU migration and the class of bug it invites. It stays on the list.
One thing I still cannot explain, in the interest of not pretending: the duplex run gives 7.23 plus 7.09 Gbit/s, while each direction on its own reaches 9.27. The Thunderbolt tunnel has room at that load, so the shortfall is somewhere in the DMA and interrupt path, and I have not run the experiment that would prove it either way.
And yes, I am already thinking about the upgrade, because dreaming costs nothing and not dreaming costs you the next build. Thunderbolt adapters faster than 10G do exist now: Sonnet’s Twin25G T5 at about a thousand dollars, ATTO’s ThunderLink NS 3252 at around 1,300, QNAP’s USB4 QNA-UC25G2SF. All of them dual-port, none of them single-port, all of them worth more than the mini-PC they would hang off. The arithmetic ruins it anyway: a TB3 tunnel hands a card roughly 22 Gbit/s, so one 25G port would almost fit and two would not, and my switch has no SFP28 cage to plug into, so the real bill is a new switch as well. A Thunderbolt 5 host would change the math properly, with 80 Gb/s on the link and 64 Gb/s of PCIe under it, but mini-PCs carrying it are only now appearing.
So the honest upgrade path for these nodes is not 25G. It is jumbo frames, a faster bulk drive, and leaving the network alone. That is a much duller answer than a thousand-dollar adapter, which is exactly why I wrote it down before ordering anything.
Proxmox first, Kubernetes second#
All four nodes run Proxmox, and Kubernetes lives strictly inside VMs. I never wanted a single OS to own the hardware.
Part of it is philosophy: these are consumer boxes with no BMC, no IPMI, no iLO. A hypervisor is what makes the workloads recoverable and rebuildable, even without out-of-band management. Set up once, they are easy to operate and easy to rebuild: when something breaks, it usually breaks inside a disposable VM while the host stays reachable. Rebuilding a node from scratch is a non-event, backed by Proxmox Backup Server and configuration management.
Part of it is what the layer buys me beyond Kubernetes: whole environments are declared in Terraform and stood up or torn down as VM sets on a software-defined network, the permanent one is wired through Argo CD, one node moonlights with a passed-through iGPU for experiments, and the odd Windows VM shows up when something needs testing. The lab currently runs multiple Kubernetes environments this way; the busiest one holds around 244 pods.
Deliberate simplicity elsewhere: no live migration, no HA auto-restart, no fencing, default quorum. The one carefully engineered failure mode is power: a UPS feeds these nodes, one of them acts as the NUT master, and on mains loss the fleet shuts itself down cleanly, in priority order. Tested repeatedly; the shutdown sequence has been reliable so far.
VM storage is local rather than ZFS- or Ceph-backed: the data tier is LUKS to ext4, and bulk shares are served over NFS and Samba. I experimented with ZFS and Ceph and walked away from both for this fleet: the memory tax and the disk churn were not buying me anything at this scale. A dedicated storage node on the 10G network is the plan for the day that stops being true.
96 GB of RAM and no regrets#
Every node was maxed out on day one: 2x48 GB. The philosophy came from an old life with AIX on Power, where machines shipped fully populated and you licensed what you used. Identical, fully loaded nodes mean no DIMM matching, no timing archaeology, no “which box has the spare slot” spreadsheet, ever.
It was also a market bet that aged embarrassingly well: the kit cost about 300 EUR per node then, and the same kit is roughly triple that today.
And the memory is not sitting idle. Utilization sits between 45% and 57% across the fleet, and the lesson of two years is blunt: in this architecture RAM is the resource that matters, then disks and network. The CPU is the thing I ration hardest (35 W!) and miss least. When something does saturate, it is usually the 10G lane during backups or when I am stress-testing AI agents, which is exactly why 40G and 100G MikroTik hardware keeps appearing in my browser tabs.
Operational notes#
A passively cooled node still needs operations discipline:
- Clearance matters. Give the case room; the chassis is the heatsink.
- Monitor throttling, do not infer it. The kernel throttle counters and RAPL power are the truth; “it feels slower” is not.
- Treat the SFP+ cage as part of the thermal budget. Even a cool DAC lives next to a NIC running at 60 C.
- Treat Thunderbolt as a bus. Enrolled device, IOMMU policy, self-healing udev rule, and then leave it alone.
- Watch the drives, not just the CPU. NVMe temperature and media errors are the canaries; media errors have stayed at zero since the pad fix, and the temperature canary is chirping on one node right now (see the table below).
The fleet, by the numbers#
Instead of claiming that all four nodes are boringly stable, here is the current fleet snapshot pulled from Prometheus while writing this post (last 15 days of retention, as of 30 July 2026; thermal counters are shown since the last boot, which was a planned kernel update five days earlier; eth1 is the 10G Thunderbolt lane):
| Metric | node A | node B | node C | node D |
|---|---|---|---|---|
| Uptime since planned reboot | 5.4 d | 5.4 d | 5.4 d | 5.4 d |
| CPU package thermal-status transitions since last boot | 59 | 0 | 0 | 146,298 |
| Max CPU package temperature, 15 d | 91 C | 83 C | 83 C | 95 C |
| Max NVMe temperature, 15 d | 64 C | 71 C | 78 C | 77 C |
| Max AQC100S NIC temperature, 15 d | 67 C | 68 C | 67 C | 67 C |
| eth1 carrier changes, 15 d | 0 | 0 | 0 | 0 |
| eth1 RX / TX errors, 15 d | 0 / 0 | 0 / 0 | 0 / 0 | 0 / 0 |
| eth1 RX drops, 15 d | 0 | 0 | 0 | 562 |
| NVMe media errors, lifetime | 0 | 0 | 0 | 0 |
| NVMe Percentage Used | 8% | 12% | 10% | 8% |
| Average RAM used, 15 d | 51% | 57% | 46% | 45% |
A few notes on the table. Each node has one CPU package, and the package counter was read once per node, never summed across logical
CPUs: the kernel mirrors that counter to every CPU, so summing cpu*/ values inflates it by the core count. The NIC temperature is
the AQC100S sensor on the Sonnet adapter, not a direct measurement of the SFP+ cage. And the 15-day CPU maxima include short PL2
bursts and real workload spikes, which is why they sit far above the steady-state 56-59 C of the controlled stress test earlier:
that test shows where the temperature settles once PL1 takes over.
Three nodes looked ordinary. One did not. Node D showed an abnormal number of CPU package thermal-status transitions since its last reboot, together with an elevated NVMe temperature profile and a small number of interface drops. I am not calling this a failed thermal interface yet; the raw counters, kernel logs and sensors need to be checked first. But the monitoring did exactly what it was supposed to do: it found a problem I would otherwise have missed.
The next maintenance action is to inspect the thermal stack and airflow on that node.
Two years in: what I would repeat#
- Fanless is not a style choice. It is a constraint that forces correctness: thermal contact, power limits, and airflow all have to be decided, not defaulted.
- Small identical nodes beat one big server for the way I actually operate: blast radius, spare capacity, and guilt-free rebuilds.
- Cap the CPU yourself. A 35 W contract you chose is better than a 100 C limit physics chooses for you.
- SFP+ over Thunderbolt is a legitimate way to give a mini-PC a real uplink: 9.27 Gbit/s of TCP goodput one way, 14.3 Gbit/s aggregate in full duplex, and a kernel log that only ever mentions the link once per boot.
- Check what is actually in your SFP+ cage. I ran “optics” for over a year before learning it was a copper cable, and the copper cable was the right choice all along.
- Measure on the live system. Sterile benchmarks flatter; production numbers you can trust.
Appendix: inventory commands#
Selected inventory and verification commands, sanitized:
sudo dmidecode -t system; sudo dmidecode -t memory
lscpu
lsblk -e7 -o NAME,MODEL,SIZE,TYPE,FSTYPE,MOUNTPOINTS,TRAN,LOG-SEC,PHY-SEC
# LOG-SEC/PHY-SEC 4096 = real 4Kn block-device geometry, not just 4K filesystem blocks
sudo smartctl -a /dev/nvme0n1   # and friends
lspci -nnk
sudo lspci -vv -s <nvme-addr>   # LnkCap vs LnkSta: how the Gen5 drive negotiates Gen4
sudo boltctl list
sensors
sudo ethtool eth1
sudo ethtool -S eth1            # per-queue/error counters behind the drops row
ip -s link                      # errors and drops as the kernel counts them
grep . /sys/class/powercap/intel-rapl:0/constraint_*_power_limit_uw
cat /sys/devices/system/cpu/cpu0/thermal_throttle/package_throttle_count
# read one logical CPU per package; do not sum cpu*/ values -
# the kernel mirrors the package counter to every CPU